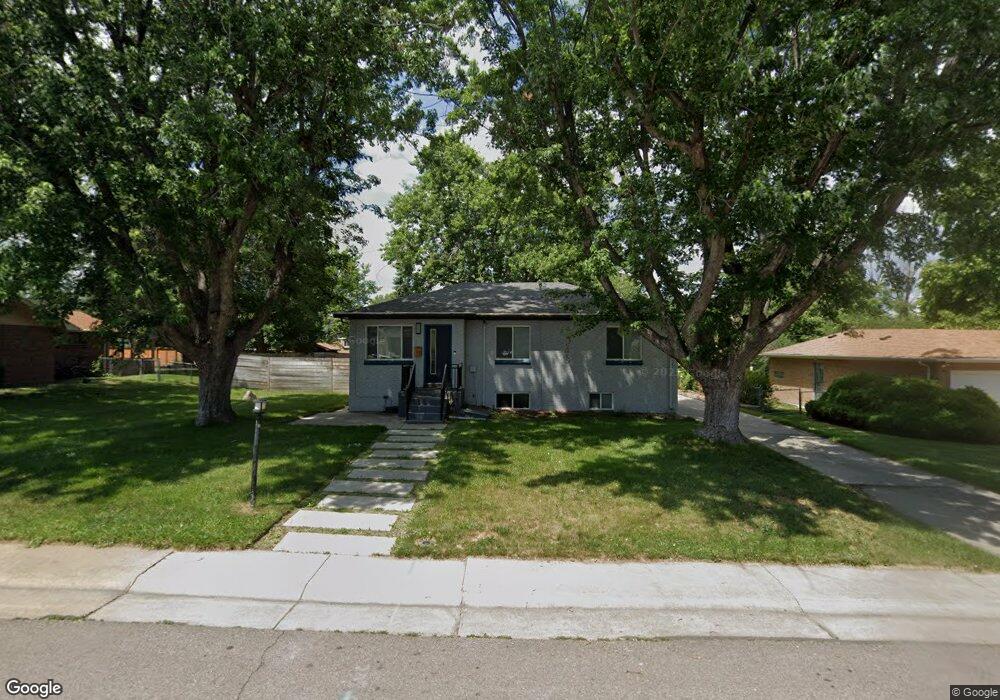
3545 Fenton St Wheat Ridge, CO 80212
East Wheat Ridge NeighborhoodEstimated Value: $767,000 - $822,000
4
Beds
3
Baths
2,144
Sq Ft
$366/Sq Ft
Est. Value
About This Home
This home is located at 3545 Fenton St, Wheat Ridge, CO 80212 and is currently estimated at $784,354, approximately $365 per square foot. 3545 Fenton St is a home located in Jefferson County with nearby schools including Stevens Elementary School, Everitt Middle School, and Wheat Ridge High School.
Ownership History
Date
Name
Owned For
Owner Type
Purchase Details
Closed on
Jul 20, 2018
Sold by
Hall Corina and Proctor Grant
Bought by
Peters Steven E
Current Estimated Value
Home Financials for this Owner
Home Financials are based on the most recent Mortgage that was taken out on this home.
Original Mortgage
$529,000
Outstanding Balance
$458,458
Interest Rate
4.5%
Mortgage Type
New Conventional
Estimated Equity
$325,897
Purchase Details
Closed on
May 11, 2016
Sold by
Drefke Laurice M and Cassa Granier Jolene
Bought by
Hall Corina and Proctor Grant
Home Financials for this Owner
Home Financials are based on the most recent Mortgage that was taken out on this home.
Original Mortgage
$321,400
Interest Rate
3.71%
Mortgage Type
New Conventional
Purchase Details
Closed on
Nov 30, 2011
Sold by
Mandril Alice Mae
Bought by
Cassa Granier Jolene and Drefke Laurice M
Create a Home Valuation Report for This Property
The Home Valuation Report is an in-depth analysis detailing your home's value as well as a comparison with similar homes in the area
Home Values in the Area
Average Home Value in this Area
Purchase History
| Date | Buyer | Sale Price | Title Company |
|---|---|---|---|
| Peters Steven E | $561,000 | Chicago Title Co | |
| Hall Corina | $401,750 | Land Title Guarantee Company | |
| Cassa Granier Jolene | -- | None Available |
Source: Public Records
Mortgage History
| Date | Status | Borrower | Loan Amount |
|---|---|---|---|
| Open | Peters Steven E | $529,000 | |
| Previous Owner | Hall Corina | $321,400 |
Source: Public Records
Tax History Compared to Growth
Tax History
| Year | Tax Paid | Tax Assessment Tax Assessment Total Assessment is a certain percentage of the fair market value that is determined by local assessors to be the total taxable value of land and additions on the property. | Land | Improvement |
|---|---|---|---|---|
| 2024 | $3,972 | $45,423 | $24,317 | $21,106 |
| 2023 | $3,972 | $45,423 | $24,317 | $21,106 |
| 2022 | $3,371 | $37,859 | $18,558 | $19,301 |
| 2021 | $3,417 | $38,948 | $19,092 | $19,856 |
| 2020 | $3,203 | $36,686 | $20,300 | $16,386 |
| 2019 | $3,160 | $36,686 | $20,300 | $16,386 |
| 2018 | $2,868 | $32,189 | $10,485 | $21,704 |
| 2017 | $2,590 | $32,189 | $10,485 | $21,704 |
| 2016 | $1,438 | $24,684 | $6,280 | $18,404 |
| 2015 | $729 | $24,684 | $6,280 | $18,404 |
| 2014 | $1,001 | $18,881 | $5,731 | $13,150 |
Source: Public Records
Map
Nearby Homes
- 3530 Fenton St
- 3515 Gray St
- 5904 W 37th Place
- 3625 Chase St
- 3530 Chase St
- 5667 W 38th Ave
- 3450 Benton St
- 6145 W 38th Ave
- 3342 Marshall St
- 3022 Fenton St
- 3501 Sheridan Blvd
- 3280 Ames St
- 4015 Fenton Ct
- 4020 Fenton Ct
- 5926 W 41st Ave Unit 10
- 3019 Chase St
- 6455 W 38th Ave
- 5051 W 35th Ave
- 3100 Ames St
- 6500 W 32nd Ave
- 3585 Fenton St
- 3505 Fenton St
- 3550 Gray St
- 3530 Gray St
- 3570 Gray St
- 3605 Fenton St
- 5783 W 35th Ave
- 3500 Gray St
- 3500 W Fenton St
- 3540 Fenton St
- 3610 Gray St
- 3590 Fenton St
- 5757 W 35th Ave
- 3635 Fenton St
- 3451 Fenton St Unit 1
- 3451 Fenton St Unit 2
- 3451 Fenton St Unit 3
- 3451 Fenton St Unit 4
- 3451 Fenton St Unit 5
- 3451 Fenton St Unit 6