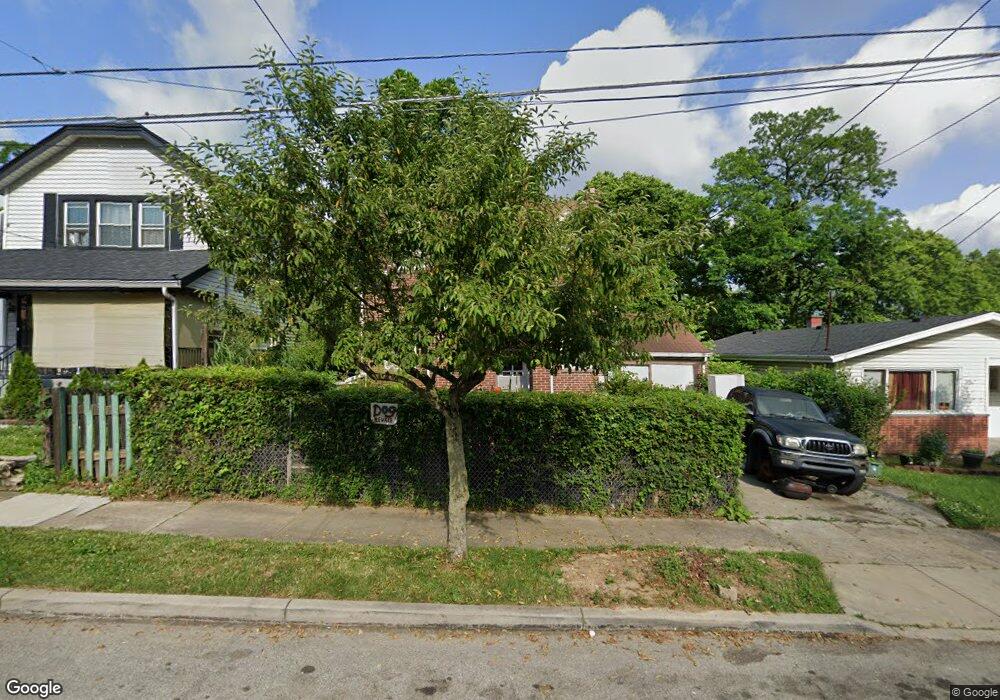
3545 Haven St Cincinnati, OH 45220
Clifton NeighborhoodEstimated Value: $101,608 - $173,000
2
Beds
1
Bath
945
Sq Ft
$138/Sq Ft
Est. Value
About This Home
This home is located at 3545 Haven St, Cincinnati, OH 45220 and is currently estimated at $130,652, approximately $138 per square foot. 3545 Haven St is a home located in Hamilton County with nearby schools including Rockdale Academy, Robert A. Taft Information Technology High School, and Clark Montessori High School.
Ownership History
Date
Name
Owned For
Owner Type
Purchase Details
Closed on
Dec 20, 1996
Sold by
Watson John S and Watson Frederick R
Bought by
January Jeremiah E and January Thelma
Current Estimated Value
Home Financials for this Owner
Home Financials are based on the most recent Mortgage that was taken out on this home.
Original Mortgage
$38,300
Interest Rate
7.64%
Mortgage Type
FHA
Create a Home Valuation Report for This Property
The Home Valuation Report is an in-depth analysis detailing your home's value as well as a comparison with similar homes in the area
Home Values in the Area
Average Home Value in this Area
Purchase History
| Date | Buyer | Sale Price | Title Company |
|---|---|---|---|
| January Jeremiah E | $38,000 | -- |
Source: Public Records
Mortgage History
| Date | Status | Borrower | Loan Amount |
|---|---|---|---|
| Previous Owner | January Jeremiah E | $38,300 |
Source: Public Records
Tax History
| Year | Tax Paid | Tax Assessment Tax Assessment Total Assessment is a certain percentage of the fair market value that is determined by local assessors to be the total taxable value of land and additions on the property. | Land | Improvement |
|---|---|---|---|---|
| 2025 | $411 | $16,633 | $4,064 | $12,569 |
| 2023 | $462 | $16,633 | $4,064 | $12,569 |
| 2022 | $437 | $15,061 | $4,050 | $11,011 |
| 2021 | $405 | $15,061 | $4,050 | $11,011 |
| 2020 | $432 | $15,061 | $4,050 | $11,011 |
| 2019 | $395 | $14,074 | $3,784 | $10,290 |
| 2018 | $396 | $14,074 | $3,784 | $10,290 |
| 2017 | $368 | $14,074 | $3,784 | $10,290 |
| 2016 | $269 | $12,709 | $3,028 | $9,681 |
| 2015 | $251 | $12,709 | $3,028 | $9,681 |
| 2014 | $253 | $12,709 | $3,028 | $9,681 |
| 2013 | $465 | $15,887 | $3,784 | $12,103 |
Source: Public Records
Map
Nearby Homes
Your Personal Tour Guide
Ask me questions while you tour the home.