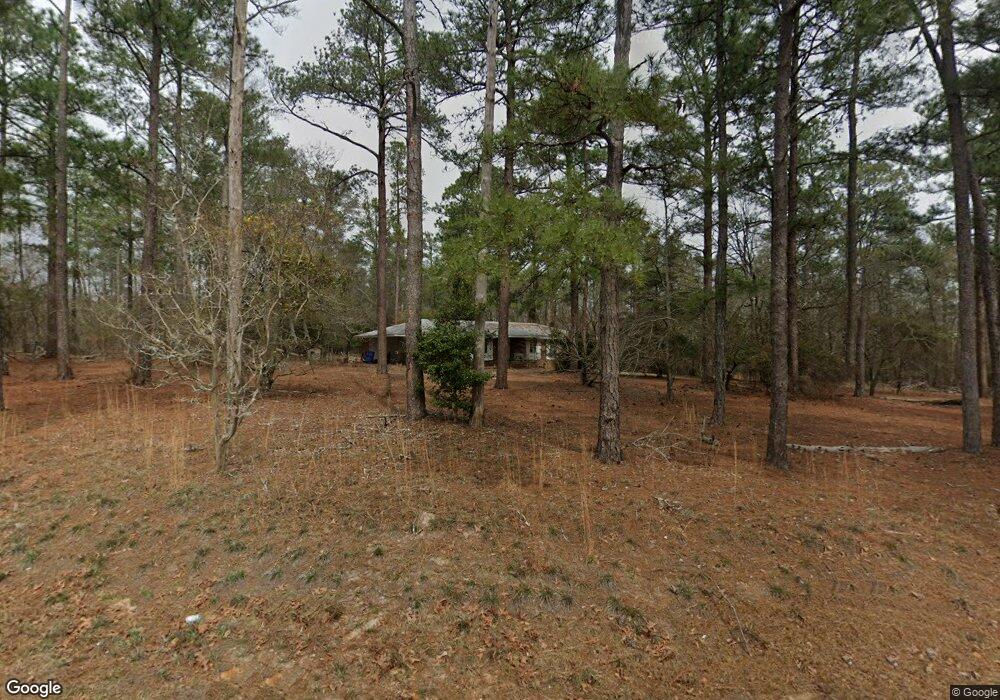
3545 Red Bud Rd Thomson, GA 30824
Estimated Value: $219,000 - $361,000
3
Beds
2
Baths
1,653
Sq Ft
$175/Sq Ft
Est. Value
About This Home
This home is located at 3545 Red Bud Rd, Thomson, GA 30824 and is currently estimated at $288,931, approximately $174 per square foot. 3545 Red Bud Rd is a home located in McDuffie County with nearby schools including Thomson High School.
Ownership History
Date
Name
Owned For
Owner Type
Purchase Details
Closed on
May 30, 2013
Sold by
Mccullough Laurie Rodgers
Bought by
Mccullough Laurie Rodgers and Mauk Becky Rodgers
Current Estimated Value
Purchase Details
Closed on
Apr 25, 1967
Bought by
Rodgers Rosanne Shields
Create a Home Valuation Report for This Property
The Home Valuation Report is an in-depth analysis detailing your home's value as well as a comparison with similar homes in the area
Home Values in the Area
Average Home Value in this Area
Purchase History
| Date | Buyer | Sale Price | Title Company |
|---|---|---|---|
| Mccullough Laurie Rodgers | -- | -- | |
| Rodgers Rosanne Shields | -- | -- |
Source: Public Records
Tax History Compared to Growth
Tax History
| Year | Tax Paid | Tax Assessment Tax Assessment Total Assessment is a certain percentage of the fair market value that is determined by local assessors to be the total taxable value of land and additions on the property. | Land | Improvement |
|---|---|---|---|---|
| 2024 | $1,808 | $72,734 | $23,468 | $49,266 |
| 2023 | $1,808 | $70,666 | $23,468 | $47,198 |
| 2022 | $1,843 | $67,725 | $23,468 | $44,257 |
| 2021 | $1,592 | $57,120 | $22,784 | $34,336 |
| 2020 | $1,546 | $54,830 | $21,363 | $33,467 |
| 2019 | $1,642 | $57,647 | $21,363 | $36,284 |
| 2018 | $1,642 | $57,647 | $21,363 | $36,284 |
| 2017 | $1,585 | $57,647 | $21,363 | $36,284 |
| 2016 | $1,585 | $57,647 | $21,363 | $36,284 |
| 2015 | $1,397 | $55,784 | $19,500 | $36,284 |
| 2014 | $1,400 | $55,784 | $19,500 | $36,284 |
| 2013 | -- | $55,784 | $19,500 | $36,284 |
Source: Public Records
Map
Nearby Homes
- 0 Liberty St
- 421 Liberty St
- 1540 Watson Bailey Rd
- 1086 Boneville Rd
- 2592 White Oak Rd
- 00 E White Oak Rd
- 7409 Fullbright Rd
- 651 Moose Club Rd
- 705 Marshall Church Rd
- 139 Margarets Rd
- 822 Matts Ln
- Magnolia Plan at Dornwood Estates
- Oakwood Plan at Dornwood Estates
- Jackson Plan at Dornwood Estates
- Harrison Plan at Dornwood Estates
- Cypress Plan at Dornwood Estates
- Cannaberra Plan at Dornwood Estates
- Camden Plan at Dornwood Estates
- Belmont Plan at Dornwood Estates
- 7204 Bill Dorn Rd Unit 10
- 3530 Red Bud Rd
- 3508 Red Bud Rd
- 3478 Red Bud Rd
- 3450 Red Bud Rd
- 0 Red Bud Rd
- 3416 Red Bud Rd
- 3419 Red Bud Rd
- 694 Shields Pond Rd
- 3371 Red Bud Rd
- 806 Howard Rd
- 3362 Red Bud Rd
- 1020 Shields Pond Rd
- 882 Howard Rd
- 637 Shields Pond Rd
- 3361 Red Bud Rd
- 0 Howard Rd
- 3343 Red Bud Rd
- 646 Shields Pond Rd
- 747 Howard Rd
- 622 Shields Pond Rd