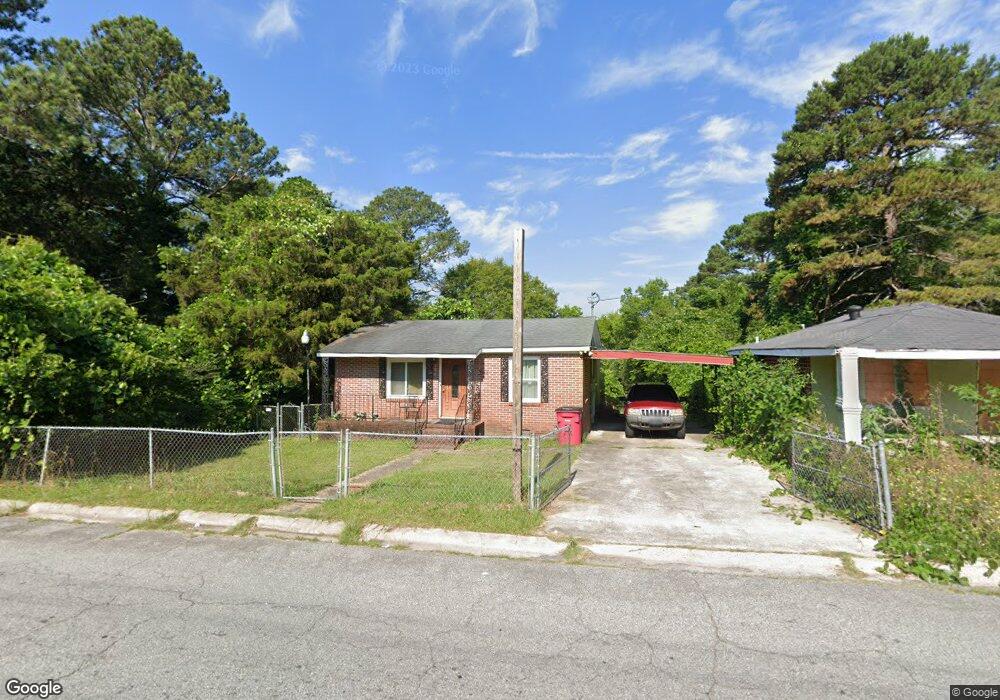
3546 Hollingsworth Rd Macon, GA 31210
Estimated Value: $46,000 - $91,000
3
Beds
2
Baths
640
Sq Ft
$107/Sq Ft
Est. Value
About This Home
This home is located at 3546 Hollingsworth Rd, Macon, GA 31210 and is currently estimated at $68,782, approximately $107 per square foot. 3546 Hollingsworth Rd is a home located in Bibb County with nearby schools including Union Elementary School, Weaver Middle School, and Westside High School.
Ownership History
Date
Name
Owned For
Owner Type
Purchase Details
Closed on
Sep 21, 2022
Sold by
Montevias Grant Rico
Bought by
Tcr Real Estate Solutions Llc
Current Estimated Value
Purchase Details
Closed on
Jun 15, 2022
Sold by
Grant Rico
Bought by
Grant Rico Montevias
Home Financials for this Owner
Home Financials are based on the most recent Mortgage that was taken out on this home.
Original Mortgage
$45,000
Interest Rate
5.27%
Mortgage Type
New Conventional
Purchase Details
Closed on
May 6, 2022
Sold by
Tcr Real Estate Solutions Llc
Bought by
Grant Rico
Home Financials for this Owner
Home Financials are based on the most recent Mortgage that was taken out on this home.
Original Mortgage
$45,000
Interest Rate
5.27%
Mortgage Type
New Conventional
Purchase Details
Closed on
Jun 29, 2020
Sold by
Simmons Michael
Bought by
Roberts Brenda
Purchase Details
Closed on
Feb 9, 1987
Sold by
Geraldine E Coon Etals
Bought by
Simmons Middie
Create a Home Valuation Report for This Property
The Home Valuation Report is an in-depth analysis detailing your home's value as well as a comparison with similar homes in the area
Home Values in the Area
Average Home Value in this Area
Purchase History
| Date | Buyer | Sale Price | Title Company |
|---|---|---|---|
| Tcr Real Estate Solutions Llc | -- | -- | |
| Grant Rico Montevias | -- | Burgess Title | |
| Grant Rico | -- | None Listed On Document | |
| Roberts Brenda | -- | Burgess Title & Escrow Llc | |
| Roberts Brenda | -- | Burgess Title & Escrow Llc | |
| Roberts Brenda | -- | Burgess Title & Escrow Llc | |
| Simmons Middie | -- | -- |
Source: Public Records
Mortgage History
| Date | Status | Borrower | Loan Amount |
|---|---|---|---|
| Previous Owner | Grant Rico Montevias | $45,000 |
Source: Public Records
Tax History Compared to Growth
Tax History
| Year | Tax Paid | Tax Assessment Tax Assessment Total Assessment is a certain percentage of the fair market value that is determined by local assessors to be the total taxable value of land and additions on the property. | Land | Improvement |
|---|---|---|---|---|
| 2025 | $336 | $13,692 | $1,800 | $11,892 |
| 2024 | $348 | $13,692 | $1,800 | $11,892 |
| 2023 | $348 | $13,692 | $1,800 | $11,892 |
| 2022 | $389 | $11,226 | $2,448 | $8,778 |
| 2021 | $137 | $3,600 | $793 | $2,807 |
| 2020 | $432 | $11,120 | $2,448 | $8,672 |
| 2019 | $435 | $11,120 | $2,448 | $8,672 |
| 2018 | $847 | $11,120 | $2,448 | $8,672 |
| 2017 | $417 | $11,120 | $2,448 | $8,672 |
| 2016 | $385 | $11,120 | $2,448 | $8,672 |
| 2015 | $545 | $11,120 | $2,448 | $8,672 |
| 2014 | $626 | $11,120 | $2,448 | $8,672 |
Source: Public Records
Map
Nearby Homes
- 3581 Hollingsworth Rd
- 4360 Mumford Rd
- 4281 Robinson Ct
- 3669 Earl St
- 3765 Del Park
- 3782 Robinson Rd
- 3491 Bond St W
- 4450 Bluebird Terrace
- 3679 W Napier Ave
- 3957 Atlantic Ave
- 3220 Hollingsworth Rd
- 3591 Napier Ave
- 1042 Washington St
- 3483 Napier Ave
- 3565 Log Cabin Dr
- 4058 Brookdale Ave
- 3515 Log Cabin Dr
- 534 Ivy Brook Way
- 3584 Log Cabin Dr
- 3554 Hollingsworth Rd
- 3547 Hollingsworth Rd
- 3555 Hollingsworth Rd
- 3559 Hollingsworth Rd
- 3516 Hollingsworth Rd
- 3533 Hollingsworth Rd
- 3535 Hollingsworth Rd
- 3569 Hollingsworth Rd
- 3529 Hollingsworth Rd
- 3573 Hollingsworth Rd
- 3496 Hollingsworth Rd
- 3496 Hollingsworth Rd
- 3548 Fair St
- 3497 Hollingsworth Rd
- 3556 Fair St
- 4239 Robinson Cir
- 3568 Fair St
- 3490 Hollingsworth Rd
- 3580 Fair St
- 3527 Hollingsworth Rd