Estimated Value: $312,257 - $403,000
3
Beds
1
Bath
2,017
Sq Ft
$184/Sq Ft
Est. Value
About This Home
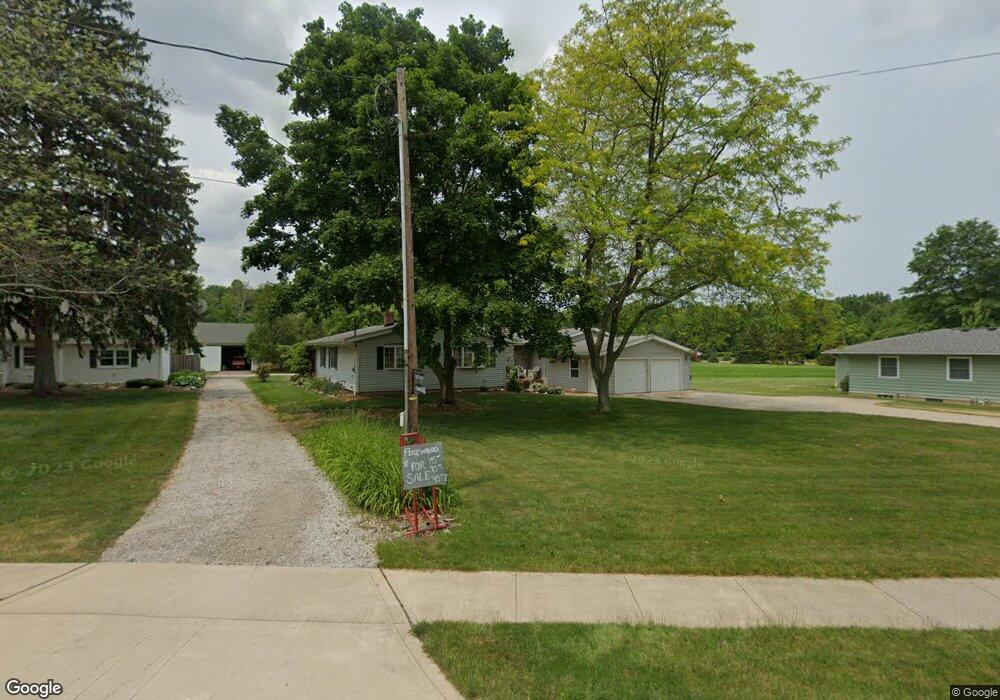
This home is located at 3546 Stoney Ridge Rd, Avon, OH 44011 and is currently estimated at $371,064, approximately $183 per square foot. 3546 Stoney Ridge Rd is a home located in Lorain County with nearby schools including Avon Heritage South Elementary School, Avon East Elementary School, and Avon Middle School.
Ownership History
Date
Name
Owned For
Owner Type
Purchase Details
Closed on
Jan 24, 2020
Sold by
Hricovec William M and Hricovec Abby L
Bought by
Wmbr Holdings Llc
Current Estimated Value
Home Financials for this Owner
Home Financials are based on the most recent Mortgage that was taken out on this home.
Original Mortgage
$176,000
Outstanding Balance
$120,358
Interest Rate
3.6%
Mortgage Type
New Conventional
Estimated Equity
$250,706
Purchase Details
Closed on
Jan 9, 2020
Sold by
Leduc Barbara J and Leduc Joyce
Bought by
Hricovec William M and Hricovec Abby L
Home Financials for this Owner
Home Financials are based on the most recent Mortgage that was taken out on this home.
Original Mortgage
$176,000
Outstanding Balance
$120,358
Interest Rate
3.6%
Mortgage Type
New Conventional
Estimated Equity
$250,706
Purchase Details
Closed on
May 5, 2015
Sold by
Estate Of Thomas G Leduc
Bought by
Leduc B Joyce
Create a Home Valuation Report for This Property
The Home Valuation Report is an in-depth analysis detailing your home's value as well as a comparison with similar homes in the area
Home Values in the Area
Average Home Value in this Area
Purchase History
| Date | Buyer | Sale Price | Title Company |
|---|---|---|---|
| Wmbr Holdings Llc | -- | None Available | |
| Hricovec William M | $220,000 | First Source Title Agcy Inc | |
| Leduc B Joyce | -- | None Available |
Source: Public Records
Mortgage History
| Date | Status | Borrower | Loan Amount |
|---|---|---|---|
| Open | Hricovec William M | $176,000 |
Source: Public Records
Tax History Compared to Growth
Tax History
| Year | Tax Paid | Tax Assessment Tax Assessment Total Assessment is a certain percentage of the fair market value that is determined by local assessors to be the total taxable value of land and additions on the property. | Land | Improvement |
|---|---|---|---|---|
| 2024 | $4,227 | $84,042 | $15,145 | $68,898 |
| 2023 | $3,607 | $63,739 | $14,119 | $49,620 |
| 2022 | $3,574 | $63,739 | $14,119 | $49,620 |
| 2021 | $3,581 | $63,739 | $14,119 | $49,620 |
| 2020 | $2,723 | $55,290 | $12,250 | $43,040 |
| 2019 | $2,667 | $55,290 | $12,250 | $43,040 |
| 2018 | $2,471 | $55,290 | $12,250 | $43,040 |
| 2017 | $2,241 | $48,070 | $11,740 | $36,330 |
| 2016 | $2,267 | $48,070 | $11,740 | $36,330 |
| 2015 | $2,290 | $48,070 | $11,740 | $36,330 |
| 2014 | $1,933 | $42,230 | $10,310 | $31,920 |
| 2013 | $1,944 | $42,230 | $10,310 | $31,920 |
Source: Public Records
Map
Nearby Homes
- 37097 Hunters Trail
- 3285 Stoney Ridge Rd
- 3283 Truxton Place
- 37826 Briar Lakes Dr
- 4292 Burberry Cir
- 36327 Wendell St
- 3292 Fairview Dr
- S/L 17 Autumn Ct
- 3473 Moon Rd
- 2463 Candlewood Dr
- S/L 19 Autumn Ct
- The Katherine Plan at Autumn Grove
- The Stony Brook Plan at Autumn Grove
- The Hampton Plan at Autumn Grove
- The Cambridge Plan at Autumn Grove
- The Alexander Plan at Autumn Grove
- The Legacy Plan at Autumn Grove
- The Avondale Plan at Autumn Grove
- The Linville Plan at Autumn Grove
- The Halsted Plan at Autumn Grove
- 3520 Stoney Ridge Rd
- 3505 Stoney Ridge Rd
- 3555 Stoney Ridge Rd
- 3500 Stoney Ridge Rd
- 3570 Stoney Ridge Rd
- 3581 Stoney Ridge Rd
- 3466 Stoney Ridge Rd
- 3599 Stoney Ridge Rd
- 22 S/L Halsted Ln
- 20 SL Halsted Ln
- 3615 Stoney Ridge Rd
- 3455 Stoney Ridge Rd
- 1 s/l Halstead Ln
- 29 SL Halsted Ln Unit 29
- 27 S/L N Halsted Ln
- 3436 Stoney Ridge Rd
- 3625 Stoney Ridge Rd
- 3443 Stoney Ridge Rd
- 36792 Bellcrest Ct
- 37116 Halsted Ln