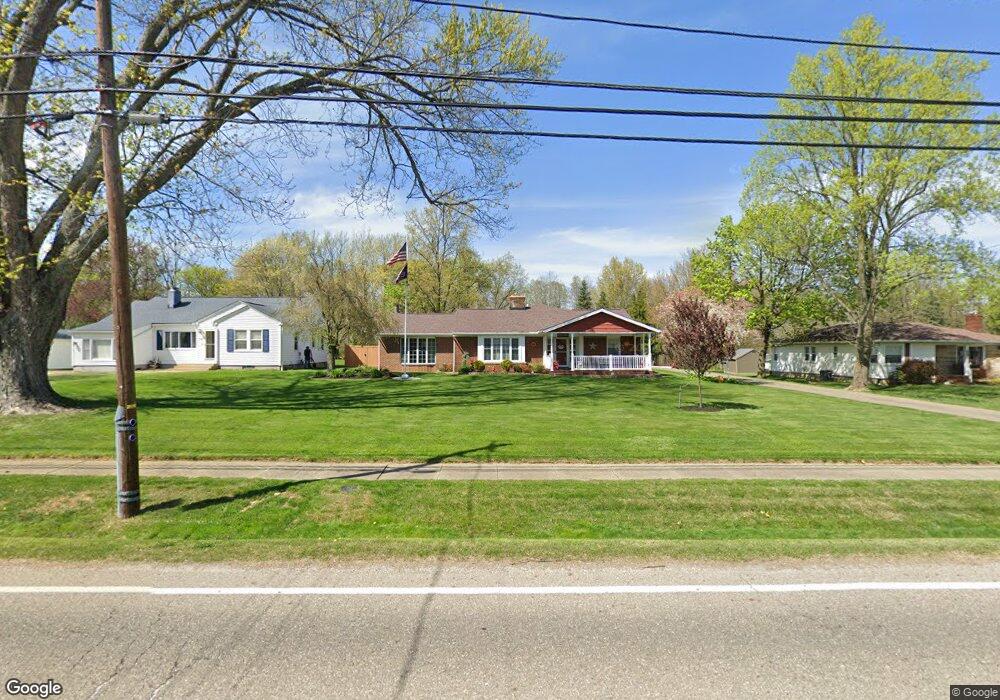
3547 Mogadore Rd Mogadore, OH 44260
Estimated Value: $306,000 - $340,875
4
Beds
3
Baths
2,524
Sq Ft
$127/Sq Ft
Est. Value
About This Home
This home is located at 3547 Mogadore Rd, Mogadore, OH 44260 and is currently estimated at $321,219, approximately $127 per square foot. 3547 Mogadore Rd is a home located in Summit County with nearby schools including O.H. Somers Elementary School, Mogadore High School, and Summit Academy Akron Elementary School.
Ownership History
Date
Name
Owned For
Owner Type
Purchase Details
Closed on
Nov 24, 2020
Sold by
Catt Marilou and Keener Robert K
Bought by
Keener Robert K and Keener Theresa A
Current Estimated Value
Home Financials for this Owner
Home Financials are based on the most recent Mortgage that was taken out on this home.
Original Mortgage
$182,750
Outstanding Balance
$162,622
Interest Rate
2.8%
Mortgage Type
New Conventional
Estimated Equity
$158,597
Purchase Details
Closed on
Nov 20, 2020
Sold by
Catt Marilou and Keener Robert K
Bought by
Keener Robert K and Keener Theresa A
Home Financials for this Owner
Home Financials are based on the most recent Mortgage that was taken out on this home.
Original Mortgage
$182,750
Outstanding Balance
$162,622
Interest Rate
2.8%
Mortgage Type
New Conventional
Estimated Equity
$158,597
Purchase Details
Closed on
Oct 30, 2017
Sold by
Catt Marilou
Bought by
Keener Robert K and Keener Theresa A
Create a Home Valuation Report for This Property
The Home Valuation Report is an in-depth analysis detailing your home's value as well as a comparison with similar homes in the area
Home Values in the Area
Average Home Value in this Area
Purchase History
| Date | Buyer | Sale Price | Title Company |
|---|---|---|---|
| Keener Robert K | -- | None Listed On Document | |
| Keener Robert K | -- | None Available | |
| Keener Robert K | -- | Bennnett Hand Title |
Source: Public Records
Mortgage History
| Date | Status | Borrower | Loan Amount |
|---|---|---|---|
| Open | Keener Robert K | $182,750 | |
| Closed | Keener Robert K | $182,750 |
Source: Public Records
Tax History Compared to Growth
Tax History
| Year | Tax Paid | Tax Assessment Tax Assessment Total Assessment is a certain percentage of the fair market value that is determined by local assessors to be the total taxable value of land and additions on the property. | Land | Improvement |
|---|---|---|---|---|
| 2025 | $5,381 | $107,958 | $15,628 | $92,330 |
| 2024 | $5,381 | $107,958 | $15,628 | $92,330 |
| 2023 | $5,381 | $107,958 | $15,628 | $92,330 |
| 2022 | $4,587 | $77,522 | $11,081 | $66,441 |
| 2021 | $4,237 | $77,522 | $11,081 | $66,441 |
| 2020 | $3,917 | $77,520 | $11,080 | $66,440 |
| 2019 | $4,104 | $76,260 | $13,880 | $62,380 |
| 2018 | $3,075 | $59,620 | $13,880 | $45,740 |
| 2017 | $3,045 | $59,800 | $13,880 | $45,920 |
| 2016 | $2,979 | $55,080 | $13,880 | $41,200 |
| 2015 | $3,045 | $55,080 | $13,880 | $41,200 |
| 2014 | $2,715 | $55,080 | $13,880 | $41,200 |
| 2013 | $2,766 | $55,280 | $13,880 | $41,400 |
Source: Public Records
Map
Nearby Homes
- 3472 Curtis St
- 48 Marion Ave
- 3665 Curtis St
- 0 Gilchrist Rd
- V/L Marion Ave
- 3756 Curtis St
- 3736 Louise St
- 233 Marion Ave
- 3755 Louise St
- 38 Walnut Ct
- 3702 Orchard St
- 3763 Orchard St
- 114 N Cleveland Ave
- 199 Elizabeth St
- 3474 Albrecht Ave
- 3874 Prospect St
- 117 Kreiner Ave
- 47 Kreiner Ave
- 3394 Albrecht Ave
- 6 Kreiner Ave
- 3553 Mogadore Rd
- 3545 Mogadore Rd
- 3545 Mogadore Rd
- 3559 Mogadore Rd
- 3563 Mogadore Rd
- 3499 Mogadore Rd
- 3495 Mogadore Rd
- 3567 Mogadore Rd
- 3544 Mogadore Rd
- 3552 Mogadore Rd
- 3538 Mogadore Rd
- 3558 Mogadore Rd
- 3489 Mogadore Rd
- 3569 Mogadore Rd
- 3485 Mogadore Rd
- 3550 Mogadore Rd
- 3568 Mogadore Rd
- 3574 Mogadore Rd
- 3573 Mogadore Rd
- 3488 Mogadore Rd