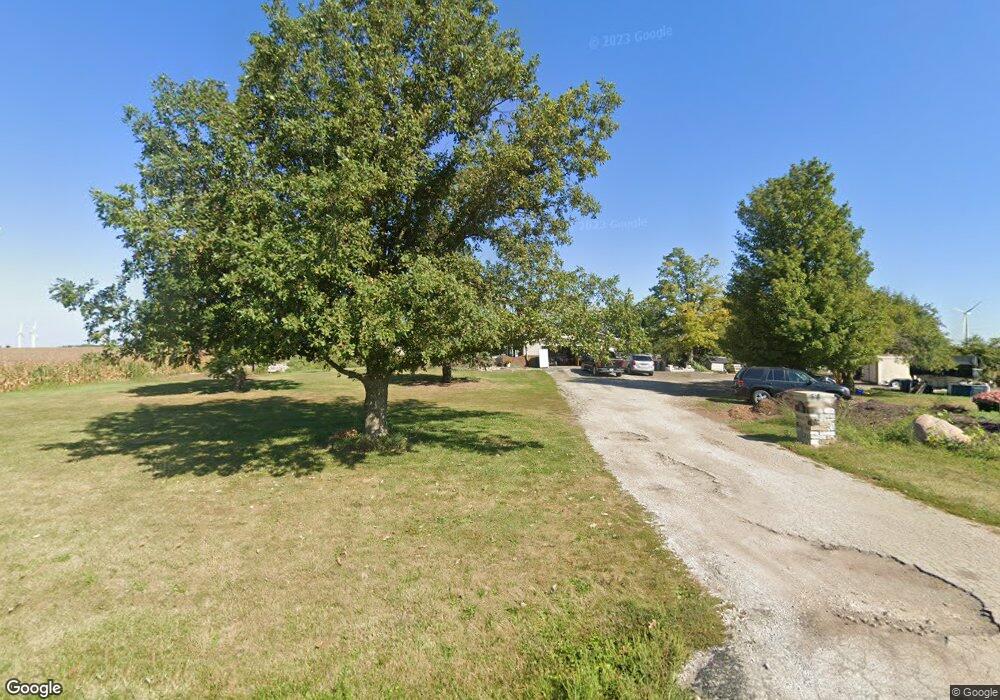
3548 W Ziebarth Rd Normal, IL 61761
Estimated Value: $255,000 - $312,691
Studio
--
Bath
1,536
Sq Ft
$187/Sq Ft
Est. Value
About This Home
This home is located at 3548 W Ziebarth Rd, Normal, IL 61761 and is currently estimated at $287,423, approximately $187 per square foot. 3548 W Ziebarth Rd is a home located in McLean County with nearby schools including Carlock Elementary School, Parkside Junior High School, and Normal Community West High School.
Ownership History
Date
Name
Owned For
Owner Type
Purchase Details
Closed on
Dec 22, 2017
Sold by
Montegero Octaivo and Montegero Irma
Bought by
Almanza Lorena and Almanza Jesusa
Current Estimated Value
Home Financials for this Owner
Home Financials are based on the most recent Mortgage that was taken out on this home.
Original Mortgage
$157,250
Outstanding Balance
$132,254
Interest Rate
3.9%
Estimated Equity
$155,169
Purchase Details
Closed on
Jan 25, 2007
Sold by
Kinzinger David W and Kinzinger April O
Bought by
Montenegro Octavio and Montenegro Irma
Purchase Details
Closed on
Oct 2, 2006
Sold by
Litherland Joseph H and Litherland Elizabeth A
Bought by
Kinzinger David W and Kinzinger April O
Home Financials for this Owner
Home Financials are based on the most recent Mortgage that was taken out on this home.
Original Mortgage
$114,529
Interest Rate
6.49%
Create a Home Valuation Report for This Property
The Home Valuation Report is an in-depth analysis detailing your home's value as well as a comparison with similar homes in the area
Purchase History
| Date | Buyer | Sale Price | Title Company |
|---|---|---|---|
| Almanza Lorena | $185,000 | Alliance Land Title | |
| Montenegro Octavio | $180,000 | None Available | |
| Kinzinger David W | $116,000 | None Available |
Source: Public Records
Mortgage History
| Date | Status | Borrower | Loan Amount |
|---|---|---|---|
| Open | Almanza Lorena | $157,250 | |
| Previous Owner | Kinzinger David W | $114,529 |
Source: Public Records
Tax History
| Year | Tax Paid | Tax Assessment Tax Assessment Total Assessment is a certain percentage of the fair market value that is determined by local assessors to be the total taxable value of land and additions on the property. | Land | Improvement |
|---|---|---|---|---|
| 2024 | $5,288 | $87,865 | $33,471 | $54,394 |
| 2022 | $5,288 | $71,435 | $27,212 | $44,223 |
| 2021 | $4,975 | $66,500 | $25,332 | $41,168 |
| 2020 | $4,873 | $64,676 | $24,637 | $40,039 |
| 2019 | $4,816 | $66,083 | $25,173 | $40,910 |
| 2018 | $4,845 | $66,083 | $25,173 | $40,910 |
| 2017 | $4,589 | $65,650 | $25,008 | $40,642 |
| 2016 | $4,462 | $63,949 | $24,360 | $39,589 |
| 2015 | $4,355 | $62,683 | $23,878 | $38,805 |
| 2014 | $4,148 | $60,722 | $23,131 | $37,591 |
| 2013 | -- | $60,722 | $23,131 | $37,591 |
Source: Public Records
Map
Nearby Homes
- 4021 W Ziebarth Rd
- 3823 W Ziebarth Rd
- 3823 W Ziebarth Rd
- 19198 N 1100 East Rd
- 4213 W Ziebarth Rd
- 4213 W Ziebarth Rd
- 4251 W Ziebarth Rd
- 2902 Mabel Rd
- 18948 N 1000 East Rd
- 9993 Us Highway 150
- 9993 Us Highway 150
- 9993 Us Highway 150
- 19425 N 1000 East Rd
- 2425 Mabel Rd
- 9872 E 1950 North Rd
- 2319 Mabel Rd
- 2319 Mabel Rd
- 19772 N 1100 East Rd
- 3004 W Ziebarth Rd
Your Personal Tour Guide
Ask me questions while you tour the home.