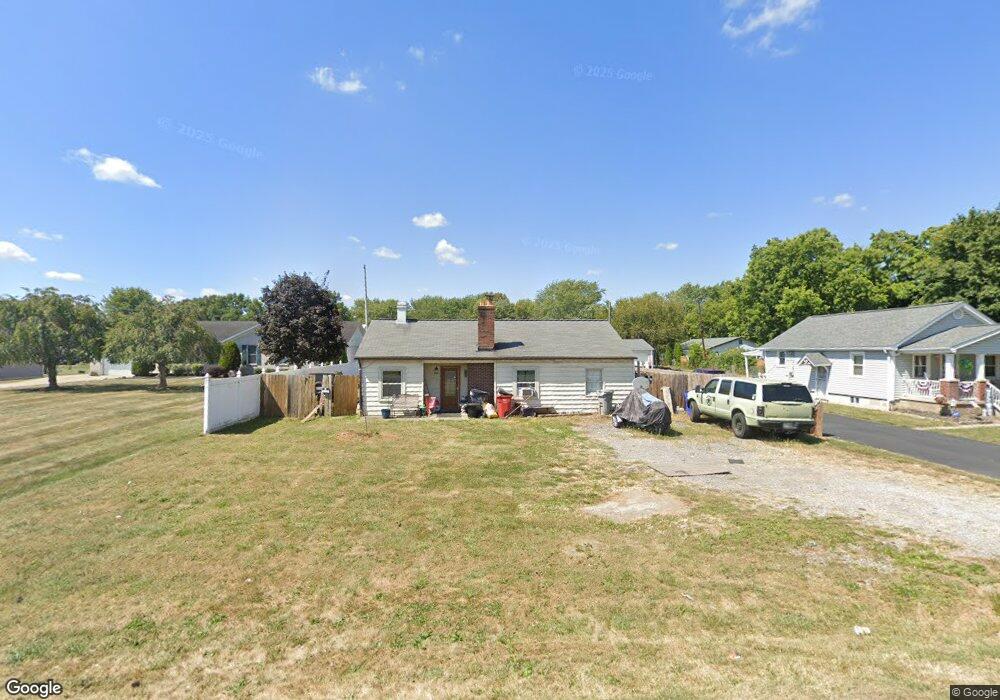
3549 Lockbourne Rd Columbus, OH 43207
Obetz-Lockbourne NeighborhoodEstimated Value: $90,000 - $134,000
3
Beds
1
Bath
800
Sq Ft
$148/Sq Ft
Est. Value
About This Home
This home is located at 3549 Lockbourne Rd, Columbus, OH 43207 and is currently estimated at $118,185, approximately $147 per square foot. 3549 Lockbourne Rd is a home located in Franklin County with nearby schools including Hamilton Intermediate School, Hamilton Elementary School, and Hamilton Middle School.
Ownership History
Date
Name
Owned For
Owner Type
Purchase Details
Closed on
Jul 21, 2022
Sold by
Robinson Rodney A
Bought by
Workman Teresa Y
Current Estimated Value
Home Financials for this Owner
Home Financials are based on the most recent Mortgage that was taken out on this home.
Original Mortgage
$76,000
Outstanding Balance
$72,286
Interest Rate
5.7%
Mortgage Type
New Conventional
Estimated Equity
$45,899
Purchase Details
Closed on
Jun 2, 2014
Sold by
Powell Ahmadi Mahmoud and Powell Ahmadi Leslie
Bought by
Robinson Rodney A
Home Financials for this Owner
Home Financials are based on the most recent Mortgage that was taken out on this home.
Original Mortgage
$57,000
Interest Rate
4.28%
Mortgage Type
New Conventional
Purchase Details
Closed on
Feb 18, 1998
Sold by
Minshall James F
Bought by
Powell Ahmadi Mahmoud and Powell Ahmadi Leslie
Purchase Details
Closed on
Nov 7, 1994
Sold by
Hogue Ronald D
Bought by
Minshall James F and Minshall Mary E
Create a Home Valuation Report for This Property
The Home Valuation Report is an in-depth analysis detailing your home's value as well as a comparison with similar homes in the area
Home Values in the Area
Average Home Value in this Area
Purchase History
| Date | Buyer | Sale Price | Title Company |
|---|---|---|---|
| Workman Teresa Y | $80,000 | Valmer Land Title | |
| Robinson Rodney A | $60,000 | Fatco | |
| Powell Ahmadi Mahmoud | $66,000 | Superior Title | |
| Minshall James F | $55,000 | -- |
Source: Public Records
Mortgage History
| Date | Status | Borrower | Loan Amount |
|---|---|---|---|
| Open | Workman Teresa Y | $76,000 | |
| Previous Owner | Robinson Rodney A | $57,000 |
Source: Public Records
Tax History
| Year | Tax Paid | Tax Assessment Tax Assessment Total Assessment is a certain percentage of the fair market value that is determined by local assessors to be the total taxable value of land and additions on the property. | Land | Improvement |
|---|---|---|---|---|
| 2025 | $1,676 | $36,680 | $11,550 | $25,130 |
| 2024 | $1,676 | $36,680 | $11,550 | $25,130 |
| 2023 | $1,667 | $36,680 | $11,550 | $25,130 |
| 2022 | $1,213 | $22,370 | $7,700 | $14,670 |
| 2021 | $1,229 | $22,370 | $7,700 | $14,670 |
| 2020 | $1,252 | $22,370 | $7,700 | $14,670 |
| 2019 | $1,192 | $18,870 | $6,410 | $12,460 |
| 2018 | $1,164 | $18,870 | $6,410 | $12,460 |
| 2017 | $1,169 | $18,870 | $6,410 | $12,460 |
| 2016 | $1,213 | $18,760 | $3,640 | $15,120 |
| 2015 | $1,151 | $18,760 | $3,640 | $15,120 |
| 2014 | $1,177 | $18,760 | $3,640 | $15,120 |
| 2013 | $647 | $19,740 | $3,815 | $15,925 |
Source: Public Records
Map
Nearby Homes
- 3531 Lockbourne Rd
- 1118 Maplewood Rd
- 1124 Rumsey Rd
- 0 Williams Rd
- 950 Radbourne Dr
- 3551 Groveport Rd
- 884 Bruckner Rd
- 1138 Hilock Rd Unit 35
- 1101 Meadow Ln
- 691 Colton Rd
- 3302 Hilock Place
- 780 Basswood Rd
- 4451 1/2 Lockbourne Rd Unit R
- 904 Kyle Ave
- 1122 Viewpointe Dr
- 3251 Hilock Ct
- 1062 Viewpointe Dr
- 1583 Metcalfe Ave
- 1670 Marshall Ave
- 3691 Ferman Rd
- 3547 Lockbourne Rd
- 3561 Lockbourne Rd
- 3575 Lockbourne Rd
- 3539 Lockbourne Rd
- 3523 Lockbourne Rd
- 3603 Lockbourne Rd
- 1134 Maplewood Rd
- 1126 Maplewood Rd
- 3615 Lockbourne Rd
- 1114 Maplewood Rd
- 1110 Maplewood Rd
- 3623 Lockbourne Rd
- 1106 Maplewood Rd
- 1144 Williams Rd
- 3631 Lockbourne Rd
- 1140 Williams Rd
- 3639 Lockbourne Rd
- 1170 Williams Rd
- 1185 Williams Rd
- 1134 Williams Rd
Your Personal Tour Guide
Ask me questions while you tour the home.