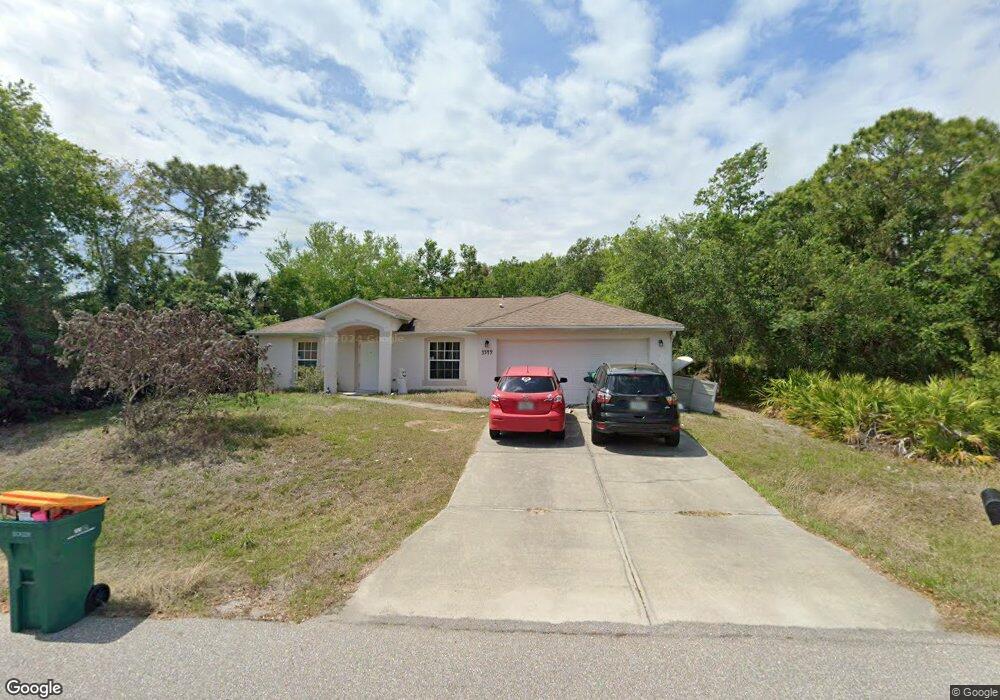
3549 Vassar St Punta Gorda, FL 33980
Estimated Value: $235,967 - $314,000
3
Beds
2
Baths
1,844
Sq Ft
$145/Sq Ft
Est. Value
About This Home
This home is located at 3549 Vassar St, Punta Gorda, FL 33980 and is currently estimated at $267,742, approximately $145 per square foot. 3549 Vassar St is a home located in Charlotte County with nearby schools including Peace River Elementary School, Port Charlotte Middle School, and Charlotte High School.
Ownership History
Date
Name
Owned For
Owner Type
Purchase Details
Closed on
Nov 24, 2014
Sold by
Hinman Stacy A and Mccart Stacy A
Bought by
Beemer Robin K
Current Estimated Value
Home Financials for this Owner
Home Financials are based on the most recent Mortgage that was taken out on this home.
Original Mortgage
$131,000
Outstanding Balance
$100,424
Interest Rate
4.02%
Mortgage Type
VA
Estimated Equity
$167,318
Purchase Details
Closed on
Apr 7, 2004
Sold by
Holiday Builders Inc
Bought by
Mccart Stacy A
Home Financials for this Owner
Home Financials are based on the most recent Mortgage that was taken out on this home.
Original Mortgage
$114,339
Interest Rate
5.38%
Mortgage Type
FHA
Purchase Details
Closed on
Jul 27, 2003
Sold by
Mccart Stacy
Bought by
Holiday Bldr Inc
Purchase Details
Closed on
Jul 2, 2003
Sold by
Graves William T and Graves Pauline
Bought by
Mccart Stacy
Create a Home Valuation Report for This Property
The Home Valuation Report is an in-depth analysis detailing your home's value as well as a comparison with similar homes in the area
Home Values in the Area
Average Home Value in this Area
Purchase History
| Date | Buyer | Sale Price | Title Company |
|---|---|---|---|
| Beemer Robin K | $131,000 | Burnt Store Title & Escrow L | |
| Mccart Stacy A | $119,900 | Landamerica Lawyers Title Co | |
| Holiday Bldr Inc | $8,500 | -- | |
| Mccart Stacy | $8,500 | -- |
Source: Public Records
Mortgage History
| Date | Status | Borrower | Loan Amount |
|---|---|---|---|
| Open | Beemer Robin K | $131,000 | |
| Previous Owner | Mccart Stacy A | $114,339 |
Source: Public Records
Tax History Compared to Growth
Tax History
| Year | Tax Paid | Tax Assessment Tax Assessment Total Assessment is a certain percentage of the fair market value that is determined by local assessors to be the total taxable value of land and additions on the property. | Land | Improvement |
|---|---|---|---|---|
| 2024 | $3,475 | $204,091 | $34,000 | $170,091 |
| 2023 | $3,475 | $149,030 | $0 | $0 |
| 2022 | $3,455 | $187,612 | $23,800 | $163,812 |
| 2021 | $3,132 | $146,272 | $9,010 | $137,262 |
| 2020 | $2,976 | $137,771 | $7,990 | $129,781 |
| 2019 | $2,854 | $132,612 | $7,990 | $124,622 |
| 2018 | $2,550 | $124,470 | $6,290 | $118,180 |
| 2017 | $2,382 | $111,373 | $6,528 | $104,845 |
| 2016 | $2,365 | $104,562 | $0 | $0 |
| 2015 | $2,146 | $95,056 | $0 | $0 |
| 2014 | $2,022 | $85,831 | $0 | $0 |
Source: Public Records
Map
Nearby Homes
- 3486 Mentone St
- 3502 Mentone St
- 3542 Mentone St
- 3490 Harvard St
- 23160 Troy Ave
- 23152 Troy Ave
- 3494 Durkee St
- 23153 Troy Ave
- 3486 Durkee St
- 23177 Troy Ave
- 3463 Durkee St
- 3503 Durkee St
- 23148 Elmira Blvd
- 3510 Shawn St
- 23182 Glen Ave
- 23177 Rye Ave
- 23214 Glen Ave
- 23422 Elmira Blvd
- 23504 Elmira Blvd
- Alexander Plan at Port Charlotte - Value
- 3478 Mentone St
- 23137 Troy Ave
- 3572 Vassar St
- 3494 Mentone St
- 3479 Mentone St
- 3534 Mentone St
- 3527 Mentone St
- 3445 Mentone St
- 3517 Vassar St
- 3483 Harvard St
- 23106 Troy Ave
- 3588 Vassar St
- 23098 Troy Ave
- 3499 Harvard St
- 3495 Mentone St
- 3478 Durkee St
- 23090 Troy Ave
- 3501 Vassar St
- 3503 Mentone St
- 23107 Elmira Blvd