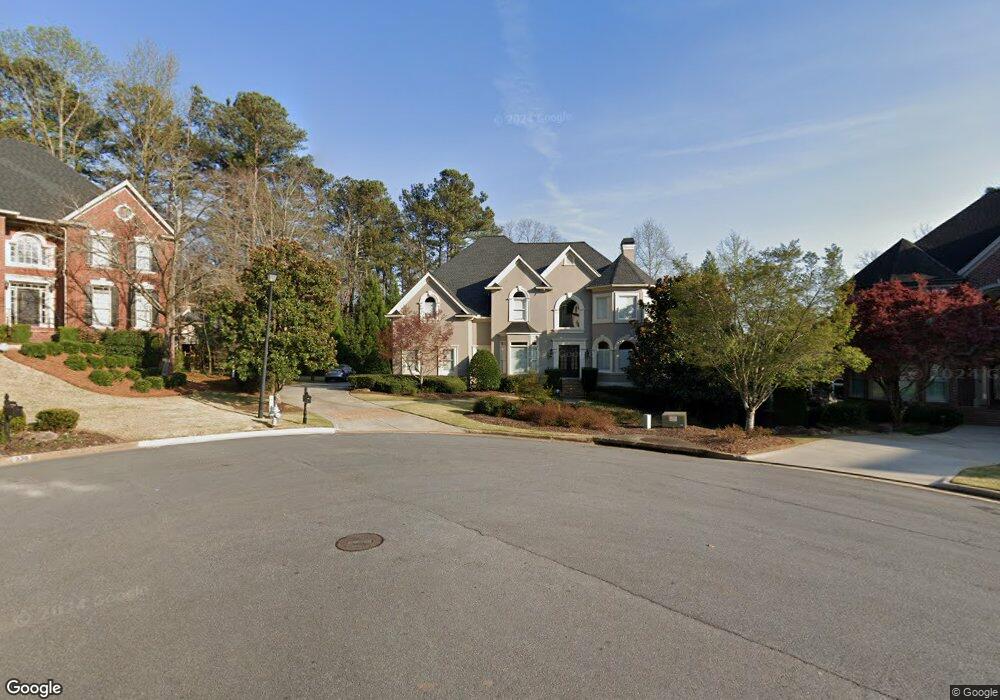
355 Broad Leaf Ct Unit 4 Alpharetta, GA 30022
Estimated Value: $1,311,116 - $1,440,000
5
Beds
5
Baths
4,201
Sq Ft
$326/Sq Ft
Est. Value
About This Home
This home is located at 355 Broad Leaf Ct Unit 4, Alpharetta, GA 30022 and is currently estimated at $1,368,779, approximately $325 per square foot. 355 Broad Leaf Ct Unit 4 is a home located in Fulton County with nearby schools including Dolvin Elementary School, Autrey Mill Middle School, and Johns Creek High School.
Ownership History
Date
Name
Owned For
Owner Type
Purchase Details
Closed on
May 10, 2005
Sold by
Cendant Mobility Financial Corp
Bought by
Jolles Scott A and Jolles Karen
Current Estimated Value
Home Financials for this Owner
Home Financials are based on the most recent Mortgage that was taken out on this home.
Original Mortgage
$572,000
Interest Rate
5.51%
Mortgage Type
New Conventional
Purchase Details
Closed on
Dec 30, 1996
Sold by
Tichelman Bart Leslie Ann
Bought by
Spivak David A Karen
Purchase Details
Closed on
Jan 9, 1996
Sold by
Linda Martin Homes Inc
Bought by
Tichelman Bart Leslieann E
Create a Home Valuation Report for This Property
The Home Valuation Report is an in-depth analysis detailing your home's value as well as a comparison with similar homes in the area
Home Values in the Area
Average Home Value in this Area
Purchase History
| Date | Buyer | Sale Price | Title Company |
|---|---|---|---|
| Jolles Scott A | $715,000 | -- | |
| Cendant Mobility Financial Corp | $715,000 | -- | |
| Spivak David A Karen | $558,200 | -- | |
| Tichelman Bart Leslieann E | $503,900 | -- |
Source: Public Records
Mortgage History
| Date | Status | Borrower | Loan Amount |
|---|---|---|---|
| Previous Owner | Cendant Mobility Financial Corp | $572,000 | |
| Closed | Tichelman Bart Leslieann E | $0 |
Source: Public Records
Tax History Compared to Growth
Tax History
| Year | Tax Paid | Tax Assessment Tax Assessment Total Assessment is a certain percentage of the fair market value that is determined by local assessors to be the total taxable value of land and additions on the property. | Land | Improvement |
|---|---|---|---|---|
| 2025 | $10,641 | $496,440 | $125,120 | $371,320 |
| 2023 | $11,884 | $421,040 | $85,560 | $335,480 |
| 2022 | $9,759 | $350,760 | $73,080 | $277,680 |
| 2021 | $9,773 | $346,000 | $68,880 | $277,120 |
| 2020 | $10,239 | $377,840 | $68,040 | $309,800 |
| 2019 | $1,164 | $371,120 | $66,840 | $304,280 |
| 2018 | $11,405 | $362,440 | $65,280 | $297,160 |
| 2017 | $10,194 | $311,680 | $51,880 | $259,800 |
| 2016 | $9,312 | $290,000 | $51,680 | $238,320 |
| 2015 | $9,414 | $290,000 | $51,680 | $238,320 |
| 2014 | $9,768 | $290,000 | $51,680 | $238,320 |
Source: Public Records
Map
Nearby Homes
- 350 Waters Bend Way
- 115 Thome Dr
- 170 Autry Trail
- 3815 Falls Landing Dr
- 10415 Plantation Bridge Dr
- 100 Nature Mill Ct Unit 8
- 10090 Jones Bridge Rd Unit 8
- 10325 Oxford Mill Cir Unit 1
- 10405 Meadow Crest Ln
- 2005 Westbourne Way Unit 2
- 10515 Colony Glen Dr Unit 2
- 320 Outwood Mill Ct
- 125 Thome Dr
- 120 Thome Dr
- 10050 Lauren Hall Ct
- 3765 Redcoat Way
- 115 Willow View Point
- 10000 Barston Ct
- 2001 Tavistock Ct
- 595 Oak Alley Way
- 345 Broad Leaf Ct
- 4000 Falls Ridge Dr
- 755 Weybridge Place
- 3990 Falls Ridge Dr Unit 1
- 4010 Falls Ridge Dr
- 765 Weybridge Place
- 320 Broad Leaf Ct
- 3980 Falls Ridge Dr
- 745 Weybridge Place Unit V
- 335 Broad Leaf Ct Unit 4
- 4020 Falls Ridge Dr Unit 1
- 310 Broad Leaf Ct
- 3970 Falls Ridge Dr
- 0 Weybridge Place Unit 3223630
- 0 Weybridge Place
- 300 Waters Bend Way Unit 1
- 735 Weybridge Place
- 3995 Falls Ridge Dr
- 0 Broad Leaf Ct
- 10135 High Falls Point