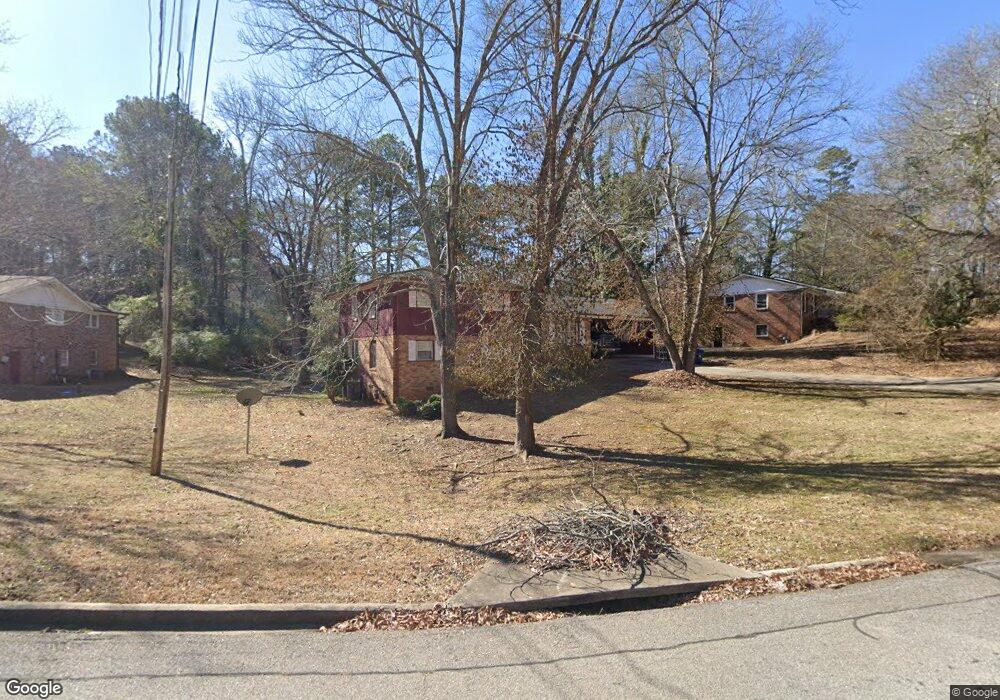
355 Cavalier Rd Athens, GA 30606
Estimated Value: $287,000 - $344,000
--
Bed
--
Bath
1,156
Sq Ft
$270/Sq Ft
Est. Value
About This Home
This home is located at 355 Cavalier Rd, Athens, GA 30606 and is currently estimated at $312,313, approximately $270 per square foot. 355 Cavalier Rd is a home located in Clarke County with nearby schools including Cleveland Road Elementary School, Burney-Harris-Lyons Middle School, and Clarke Central High School.
Ownership History
Date
Name
Owned For
Owner Type
Purchase Details
Closed on
Dec 22, 2006
Sold by
Not Provided
Bought by
Moon Greg and Moon
Current Estimated Value
Home Financials for this Owner
Home Financials are based on the most recent Mortgage that was taken out on this home.
Original Mortgage
$117,000
Outstanding Balance
$82,529
Interest Rate
9.95%
Mortgage Type
New Conventional
Estimated Equity
$229,784
Purchase Details
Closed on
May 7, 1998
Sold by
Secretary Of Veterans Affairs
Bought by
Moon Greg Aka Gregory Moon
Purchase Details
Closed on
Jan 6, 1998
Sold by
Bagwell William F
Bought by
Secretary Of Veterans Affairs
Purchase Details
Closed on
Nov 21, 1994
Sold by
May Linda G Mrs
Bought by
Bagwell William F
Purchase Details
Closed on
Aug 21, 1990
Sold by
May Robert R and May Linda G
Bought by
May Linda G Mrs
Create a Home Valuation Report for This Property
The Home Valuation Report is an in-depth analysis detailing your home's value as well as a comparison with similar homes in the area
Home Values in the Area
Average Home Value in this Area
Purchase History
| Date | Buyer | Sale Price | Title Company |
|---|---|---|---|
| Moon Greg | -- | -- | |
| Moon Greg Aka Gregory Moon | $89,500 | -- | |
| Secretary Of Veterans Affairs | -- | -- | |
| Bagwell William F | $84,900 | -- | |
| May Linda G Mrs | -- | -- |
Source: Public Records
Mortgage History
| Date | Status | Borrower | Loan Amount |
|---|---|---|---|
| Open | Moon Greg | $117,000 |
Source: Public Records
Tax History Compared to Growth
Tax History
| Year | Tax Paid | Tax Assessment Tax Assessment Total Assessment is a certain percentage of the fair market value that is determined by local assessors to be the total taxable value of land and additions on the property. | Land | Improvement |
|---|---|---|---|---|
| 2025 | $2,365 | $95,368 | $12,000 | $83,368 |
| 2024 | $2,365 | $92,083 | $12,000 | $80,083 |
| 2023 | $1,562 | $84,999 | $12,000 | $72,999 |
| 2022 | $1,902 | $69,621 | $10,400 | $59,221 |
| 2021 | $1,707 | $60,640 | $10,400 | $50,240 |
| 2020 | $1,598 | $57,415 | $10,400 | $47,015 |
| 2019 | $1,436 | $52,309 | $9,600 | $42,709 |
| 2018 | $1,294 | $48,127 | $9,600 | $38,527 |
| 2017 | $1,191 | $45,085 | $9,600 | $35,485 |
| 2016 | $1,090 | $42,093 | $9,600 | $32,493 |
| 2015 | $1,105 | $42,484 | $9,600 | $32,884 |
| 2014 | $1,111 | $42,612 | $9,600 | $33,012 |
Source: Public Records
Map
Nearby Homes
- 256 Cherokee Ridge
- 532 Huntington Rd Unit 7
- 470 Huntington Rd Unit 5
- 141 Huntington Shoals Dr
- 637 Huntington Rd Unit B1
- 170 Huntington Ct
- 450 River Bottom Rd
- 212 Huntington Shoals Dr
- 241 Meeler Cir
- 240 W Huntington Rd
- 115 Woodhaven St
- 860 Mitchell Bridge Rd Unit 8
- 860 Mitchell Bridge Rd Unit 8
- 212 Meeler Cir
- 150 The Preserve Dr Unit H2
- 164 Lucy Ln
- 190 W Huntington Rd
- 184 Hillsborough Dr
- 355 Cavalier Rd
- 345 Cavalier Rd
- 365 Cavalier Rd
- 335 Cavalier Rd
- 196 Cherokee Ridge
- 188 Cherokee Ridge
- 198 Cherokee Ridge
- 350 Cavalier Rd
- 340 Cavalier Rd
- 370 Cavalier Rd
- 325 Cavalier Rd
- 360 Cavalier Rd
- 186 Cherokee Ridge
- 200 Cherokee Ridge
- 330 Cavalier Rd
- 215 Biscayne Dr
- 225 Biscayne Dr
- 405 Cavalier Rd
- 195 Cherokee Ridge
- 170 Cherokee Ridge