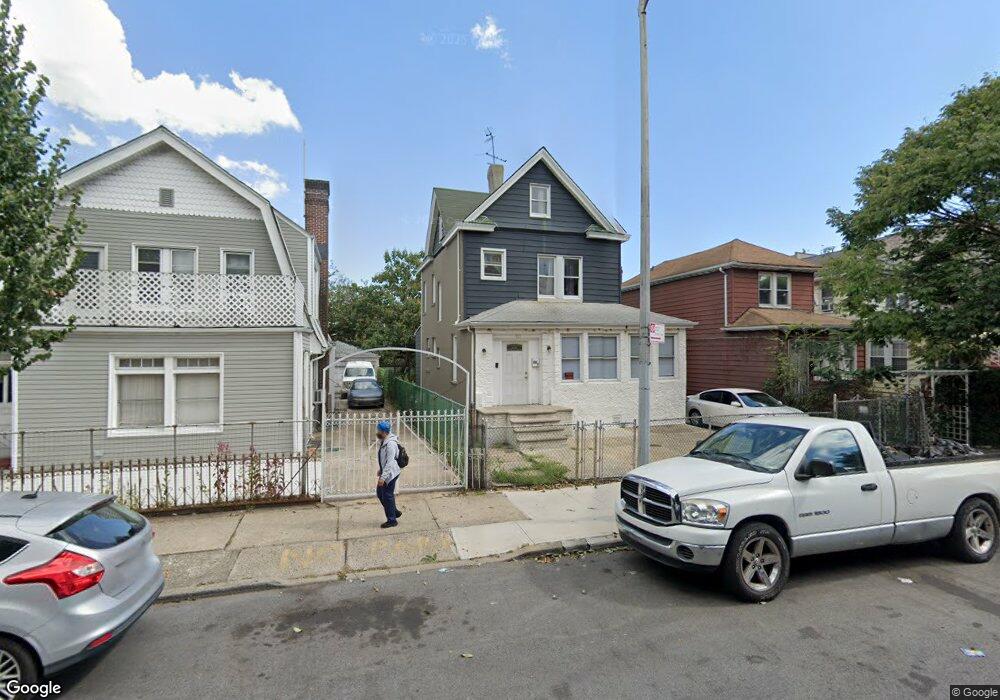
355 E 53rd St Brooklyn, NY 11203
East Flatbush NeighborhoodEstimated Value: $698,000 - $808,000
Studio
--
Bath
1,508
Sq Ft
$506/Sq Ft
Est. Value
About This Home
This home is located at 355 E 53rd St, Brooklyn, NY 11203 and is currently estimated at $763,453, approximately $506 per square foot. 355 E 53rd St is a home located in Kings County with nearby schools including Ps 244 Richard R Green, East Flatbush Community Research School, and Kings Elementary School.
Ownership History
Date
Name
Owned For
Owner Type
Purchase Details
Closed on
Aug 25, 2005
Sold by
Capers Ethel and Capers Tanisha
Bought by
Capers Tanisha
Current Estimated Value
Purchase Details
Closed on
Jan 13, 2003
Sold by
Atlantic Foreclosure Research Ltd and Ciazlino Realty Corp
Bought by
Capers Ethel and Capers Tannisha
Purchase Details
Closed on
Aug 26, 2002
Sold by
Joseph Myrtle Hr
Bought by
Atalantic Research Ltd and Ciazlino Realty Corp
Create a Home Valuation Report for This Property
The Home Valuation Report is an in-depth analysis detailing your home's value as well as a comparison with similar homes in the area
Home Values in the Area
Average Home Value in this Area
Purchase History
| Date | Buyer | Sale Price | Title Company |
|---|---|---|---|
| Capers Tanisha | -- | -- | |
| Capers Tanisha | -- | -- | |
| Capers Ethel | $334,000 | -- | |
| Capers Ethel | $334,000 | -- | |
| Atalantic Research Ltd | -- | -- | |
| Atalantic Research Ltd | -- | -- |
Source: Public Records
Mortgage History
| Date | Status | Borrower | Loan Amount |
|---|---|---|---|
| Closed | Capers Ethel | $0 |
Source: Public Records
Tax History
| Year | Tax Paid | Tax Assessment Tax Assessment Total Assessment is a certain percentage of the fair market value that is determined by local assessors to be the total taxable value of land and additions on the property. | Land | Improvement |
|---|---|---|---|---|
| 2025 | $6,009 | $39,960 | $21,180 | $18,780 |
| 2024 | $6,009 | $39,420 | $21,180 | $18,240 |
| 2023 | $5,734 | $48,000 | $21,180 | $26,820 |
| 2022 | $5,321 | $41,640 | $21,180 | $20,460 |
| 2021 | $5,292 | $41,160 | $21,180 | $19,980 |
| 2020 | $2,630 | $32,220 | $21,180 | $11,040 |
| 2019 | $5,215 | $32,220 | $21,180 | $11,040 |
| 2018 | $4,796 | $23,527 | $12,977 | $10,550 |
| 2017 | $4,528 | $22,213 | $12,729 | $9,484 |
| 2016 | $4,189 | $20,956 | $15,639 | $5,317 |
| 2015 | $2,527 | $20,948 | $14,223 | $6,725 |
| 2014 | $2,527 | $20,775 | $12,000 | $8,775 |
Source: Public Records
Map
Nearby Homes
- 5319 Church Ave
- 435 E 51st St
- 455 E 51st St
- 5112 Snyder Ave
- 463 E 52nd St
- 234 E 54th St
- 227 E 56th St
- 5606 Snyder Ave
- 814 Linden Blvd
- 510 E 51st St
- 343 E 51st St
- 529 E 51st St
- 175 E 55th St
- 522 E 51st St
- 449 E 49th St
- 451 E 49th St
- 886 Linden Blvd Unit 888
- 890 Linden Blvd
- 5727 Kings Hwy
- 783 Linden Blvd
Your Personal Tour Guide
Ask me questions while you tour the home.