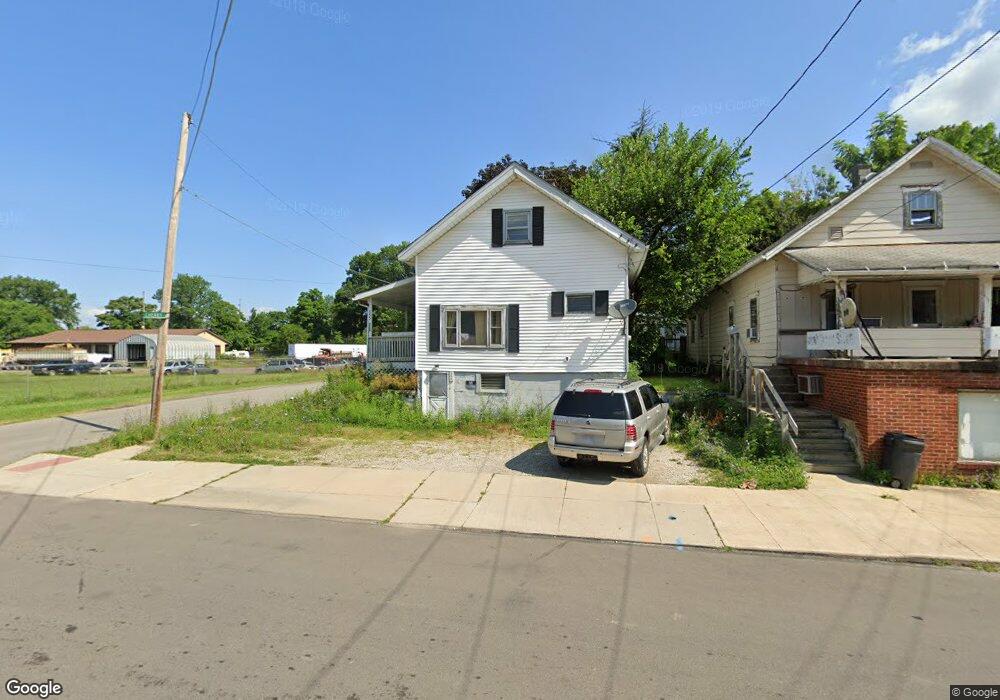
355 Grace St Mansfield, OH 44905
Estimated Value: $74,009 - $106,000
2
Beds
1
Bath
1,156
Sq Ft
$77/Sq Ft
Est. Value
About This Home
This home is located at 355 Grace St, Mansfield, OH 44905 and is currently estimated at $88,502, approximately $76 per square foot. 355 Grace St is a home located in Richland County with nearby schools including Temple-Christian School, St. Peter's Elementary/Montessori School, and St. Peter's High School/Junior High.
Ownership History
Date
Name
Owned For
Owner Type
Purchase Details
Closed on
Oct 15, 2021
Sold by
Tackett Wesley and Tackett Douglas
Bought by
Bryant William J
Current Estimated Value
Purchase Details
Closed on
Aug 12, 2021
Sold by
Estate Of Peggy I Roose
Bought by
Tackett Wesley and Tackett Douglas
Purchase Details
Closed on
Oct 23, 2015
Sold by
Togliatti Rodney J and Togliatti Dana
Bought by
Roose Peggy I
Purchase Details
Closed on
Jun 1, 2006
Sold by
Tupps Thomas W and Tupps Rhonda
Bought by
Hud
Purchase Details
Closed on
Oct 27, 2000
Sold by
Ball Joseph F
Bought by
Tupps Thomas W
Home Financials for this Owner
Home Financials are based on the most recent Mortgage that was taken out on this home.
Original Mortgage
$43,477
Interest Rate
7.9%
Mortgage Type
FHA
Purchase Details
Closed on
Apr 4, 2000
Sold by
Shrf Jimmie L Mollett Pr
Bought by
Ball Joseph F
Purchase Details
Closed on
May 14, 1996
Sold by
Shrf Louise Sword Pr
Bought by
Baretta Mike
Create a Home Valuation Report for This Property
The Home Valuation Report is an in-depth analysis detailing your home's value as well as a comparison with similar homes in the area
Home Values in the Area
Average Home Value in this Area
Purchase History
| Date | Buyer | Sale Price | Title Company |
|---|---|---|---|
| Bryant William J | $12,350 | None Available | |
| Tackett Wesley | -- | None Available | |
| Roose Peggy I | $5,800 | Attorney | |
| Hud | $30,000 | None Available | |
| Tupps Thomas W | $43,500 | -- | |
| Ball Joseph F | $27,000 | -- | |
| Baretta Mike | $3,600 | -- |
Source: Public Records
Mortgage History
| Date | Status | Borrower | Loan Amount |
|---|---|---|---|
| Previous Owner | Tupps Thomas W | $43,477 |
Source: Public Records
Tax History Compared to Growth
Tax History
| Year | Tax Paid | Tax Assessment Tax Assessment Total Assessment is a certain percentage of the fair market value that is determined by local assessors to be the total taxable value of land and additions on the property. | Land | Improvement |
|---|---|---|---|---|
| 2024 | $316 | $6,750 | $1,010 | $5,740 |
| 2023 | $316 | $6,750 | $1,010 | $5,740 |
| 2022 | $242 | $4,330 | $1,020 | $3,310 |
| 2021 | $249 | $4,330 | $1,020 | $3,310 |
| 2020 | $255 | $4,330 | $1,020 | $3,310 |
| 2019 | $385 | $4,330 | $1,020 | $3,310 |
| 2018 | $279 | $4,330 | $1,020 | $3,310 |
| 2017 | $271 | $4,330 | $1,020 | $3,310 |
| 2016 | $325 | $5,030 | $1,420 | $3,610 |
| 2015 | $310 | $5,030 | $1,420 | $3,610 |
| 2014 | $306 | $5,030 | $1,420 | $3,610 |
| 2012 | $121 | $5,190 | $1,470 | $3,720 |
Source: Public Records
Map
Nearby Homes