J
Landlord's Agent in 2024
John Breaux
Progress Residential PropertyManager
(316) 249-9675
Estimated Value: $357,693 - $367,000
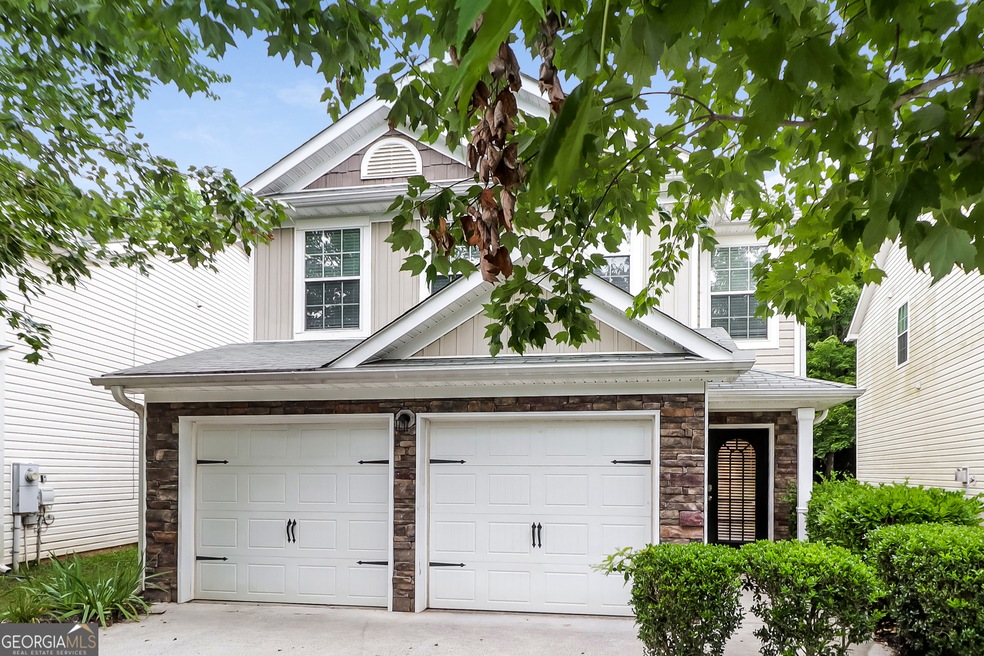
Like all our homes, this one features: a great location in a desirable neighborhood, a comfortable layout with good-sized bedrooms and bathrooms, a great kitchen with plenty of counter and cabinet space, many updated and upgraded features, central HVAC and programmable thermostat, garage and a spacious yard, and it's pet friendly.
Last Agent to Rent the Property
Progress Residential PropertyManager License #429165 Listed on: 12/04/2023
Last Renter's Agent
Progress Residential PropertyManager License #429165 Listed on: 12/04/2023
| Date | Buyer | Sale Price | Title Company |
|---|---|---|---|
| Progress Residential Borrower 18 Llc | -- | -- | |
| Progress Atlanta Llc | $275,000 | -- |
| Date | Event | Price | List to Sale | Price per Sq Ft |
|---|---|---|---|---|
| 02/01/2024 02/01/24 | Rented | $2,120 | 0.0% | -- |
| 01/18/2024 01/18/24 | Price Changed | $2,120 | +0.5% | $1 / Sq Ft |
| 01/12/2024 01/12/24 | Price Changed | $2,110 | +0.2% | $1 / Sq Ft |
| 01/11/2024 01/11/24 | Price Changed | $2,105 | -0.2% | $1 / Sq Ft |
| 01/10/2024 01/10/24 | Price Changed | $2,110 | +0.2% | $1 / Sq Ft |
| 01/09/2024 01/09/24 | Price Changed | $2,105 | -0.2% | $1 / Sq Ft |
| 01/05/2024 01/05/24 | Price Changed | $2,110 | +0.2% | $1 / Sq Ft |
| 01/04/2024 01/04/24 | Price Changed | $2,105 | -0.5% | $1 / Sq Ft |
| 01/03/2024 01/03/24 | Price Changed | $2,115 | +0.2% | $1 / Sq Ft |
| 01/02/2024 01/02/24 | Price Changed | $2,110 | +0.2% | $1 / Sq Ft |
| 12/29/2023 12/29/23 | Price Changed | $2,105 | -0.2% | $1 / Sq Ft |
| 12/26/2023 12/26/23 | Price Changed | $2,110 | +0.5% | $1 / Sq Ft |
| 12/22/2023 12/22/23 | Price Changed | $2,100 | -0.5% | $1 / Sq Ft |
| 12/20/2023 12/20/23 | Price Changed | $2,110 | -0.2% | $1 / Sq Ft |
| 12/19/2023 12/19/23 | Price Changed | $2,115 | +0.5% | $1 / Sq Ft |
| 12/15/2023 12/15/23 | Price Changed | $2,105 | -1.4% | $1 / Sq Ft |
| 12/04/2023 12/04/23 | For Rent | $2,135 | -- | -- |
| Year | Tax Paid | Tax Assessment Tax Assessment Total Assessment is a certain percentage of the fair market value that is determined by local assessors to be the total taxable value of land and additions on the property. | Land | Improvement |
|---|---|---|---|---|
| 2025 | $4,003 | $139,116 | $30,000 | $109,116 |
| 2024 | $3,556 | $124,252 | $28,000 | $96,252 |
| 2023 | $3,842 | $134,228 | $26,000 | $108,228 |
| 2022 | $3,072 | $107,044 | $21,600 | $85,444 |
| 2021 | $2,532 | $89,820 | $17,200 | $72,620 |
| 2020 | $2,387 | $83,996 | $16,000 | $67,996 |
| 2019 | $2,088 | $72,120 | $14,000 | $58,120 |
| 2018 | $2,057 | $70,560 | $14,000 | $56,560 |
| 2017 | $1,552 | $162,600 | $12,000 | $53,040 |
| 2016 | $1,552 | $157,900 | $12,000 | $51,160 |
| 2015 | $1,438 | $145,000 | $9,600 | $48,400 |
| 2014 | $1,637 | $132,300 | $9,600 | $43,320 |
J
Landlord's Agent in 2024
John Breaux
Progress Residential PropertyManager
(316) 249-9675
Source: Georgia MLS
MLS Number: 10230381
APN: 15N14L-00000-063-000
Disclaimer: Certain information contained herein is derived from information provided by parties other than Homes.com. All information provided is deemed reliable, but is not guaranteed to be accurate and should be independently verified.
![]() The data relating to real estate for sale on this web site comes in part from the Broker Reciprocity Program of Georgia MLS. Real estate listings held by brokerage firms other than Redfin are marked with the Broker Reciprocity logo and detailed information about them includes the name of the listing brokers. Information deemed reliable but not guaranteed. Copyright 2025 Georgia MLS. All rights reserved.
The data relating to real estate for sale on this web site comes in part from the Broker Reciprocity Program of Georgia MLS. Real estate listings held by brokerage firms other than Redfin are marked with the Broker Reciprocity logo and detailed information about them includes the name of the listing brokers. Information deemed reliable but not guaranteed. Copyright 2025 Georgia MLS. All rights reserved.
