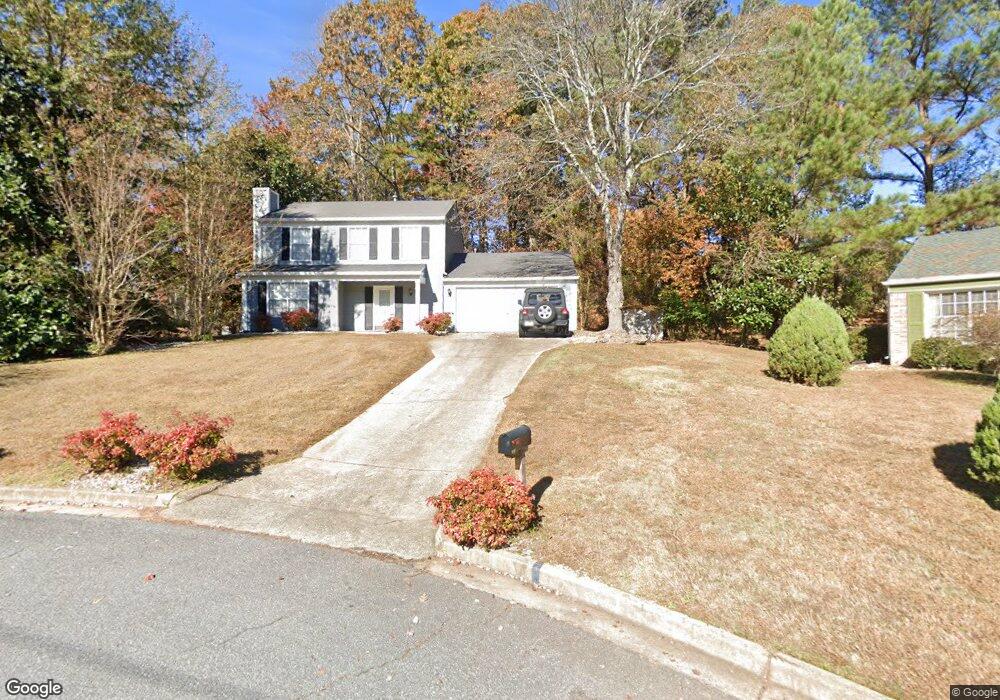
355 Knoll Ridge Ct Unit 4 Alpharetta, GA 30022
Estimated Value: $372,000 - $404,168
3
Beds
3
Baths
1,396
Sq Ft
$282/Sq Ft
Est. Value
About This Home
This home is located at 355 Knoll Ridge Ct Unit 4, Alpharetta, GA 30022 and is currently estimated at $393,042, approximately $281 per square foot. 355 Knoll Ridge Ct Unit 4 is a home located in Fulton County with nearby schools including Northwood Elementary School, Haynes Bridge Middle School, and Centennial High School.
Ownership History
Date
Name
Owned For
Owner Type
Purchase Details
Closed on
Mar 15, 2007
Sold by
Polensek Robert
Bought by
Webb John B
Current Estimated Value
Home Financials for this Owner
Home Financials are based on the most recent Mortgage that was taken out on this home.
Original Mortgage
$140,000
Outstanding Balance
$82,964
Interest Rate
5.88%
Mortgage Type
New Conventional
Estimated Equity
$310,078
Purchase Details
Closed on
Mar 24, 2005
Sold by
Guffey Daryl R and Guffey Heather
Bought by
Polensek Robert
Home Financials for this Owner
Home Financials are based on the most recent Mortgage that was taken out on this home.
Original Mortgage
$130,000
Interest Rate
5.57%
Mortgage Type
New Conventional
Purchase Details
Closed on
Feb 9, 2001
Sold by
Sams Carole O
Bought by
Guffey Heather D and Guffey Daryl R
Home Financials for this Owner
Home Financials are based on the most recent Mortgage that was taken out on this home.
Original Mortgage
$126,300
Interest Rate
7.03%
Mortgage Type
FHA
Create a Home Valuation Report for This Property
The Home Valuation Report is an in-depth analysis detailing your home's value as well as a comparison with similar homes in the area
Home Values in the Area
Average Home Value in this Area
Purchase History
| Date | Buyer | Sale Price | Title Company |
|---|---|---|---|
| Webb John B | $175,000 | -- | |
| Polensek Robert | $162,500 | -- | |
| Guffey Heather D | $128,300 | -- |
Source: Public Records
Mortgage History
| Date | Status | Borrower | Loan Amount |
|---|---|---|---|
| Open | Webb John B | $140,000 | |
| Previous Owner | Polensek Robert | $130,000 | |
| Previous Owner | Guffey Heather D | $126,300 |
Source: Public Records
Tax History Compared to Growth
Tax History
| Year | Tax Paid | Tax Assessment Tax Assessment Total Assessment is a certain percentage of the fair market value that is determined by local assessors to be the total taxable value of land and additions on the property. | Land | Improvement |
|---|---|---|---|---|
| 2025 | $212 | $135,960 | $32,920 | $103,040 |
| 2023 | $3,505 | $124,160 | $24,920 | $99,240 |
| 2022 | $1,431 | $113,920 | $25,480 | $88,440 |
| 2021 | $1,581 | $97,240 | $21,440 | $75,800 |
| 2020 | $1,579 | $90,400 | $19,240 | $71,160 |
| 2019 | $180 | $87,560 | $20,040 | $67,520 |
| 2018 | $1,521 | $67,960 | $13,400 | $54,560 |
| 2017 | $1,344 | $58,000 | $11,640 | $46,360 |
| 2016 | $1,342 | $58,000 | $11,640 | $46,360 |
| 2015 | $1,481 | $58,000 | $11,640 | $46,360 |
| 2014 | $1,133 | $49,720 | $11,400 | $38,320 |
Source: Public Records
Map
Nearby Homes
- 225 Wentworth Terrace
- 10421 Park Walk Point
- 530 Kearny St
- 3273 Long Indian Creek Ct
- 3195 Waters Mill Dr
- 385 Birch Rill Dr
- 3077 Haynes Trail
- 305 Birch Rill Dr
- 10530 Haynes Forest Dr
- 130 Forrest View Terrace
- 10085 Old Woodland Entry
- 3040 Roxburgh Dr
- 201 Downing Dr Unit 76
- 10280 Crescent Ridge Dr
- 3430 Waters Mill Dr
- 3396 Carverton Ln
- 105 May Glen Way
- 345 Knoll Ridge Ct Unit 4
- 450 Rill Crest Ct
- 360 Knoll Ridge Ct Unit 4
- 880 Thornberry Dr
- 440 Rill Crest Ct Unit 4
- 335 Knoll Ridge Ct
- 0 Rill Crest Ct Unit 7556510
- 0 Rill Crest Ct Unit 8929128
- 0 Rill Crest Ct Unit 7464318
- 0 Rill Crest Ct Unit 7003664
- 460 Rill Crest Ct
- 460 Rill Crest Ct Unit 4
- 855 Thornberry Dr Unit 2
- 350 Knoll Ridge Ct
- 430 Rill Crest Ct
- 340 Knoll Ridge Ct Unit 423
- 340 Knoll Ridge Ct
- 340 Knoll Ridge Ct Unit 53
- 0 Knoll Ridge Ct Unit 8688925
- 0 Knoll Ridge Ct Unit 8428199