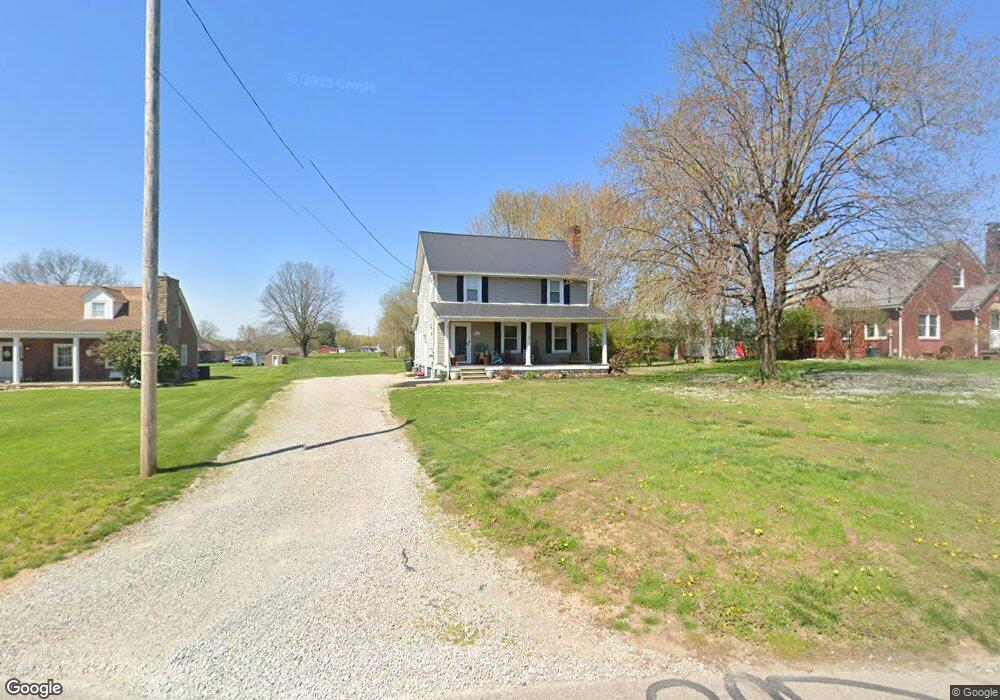
355 Mound Rd Duncan Falls, OH 43734
Estimated Value: $254,000 - $294,000
4
Beds
3
Baths
1,784
Sq Ft
$154/Sq Ft
Est. Value
About This Home
This home is located at 355 Mound Rd, Duncan Falls, OH 43734 and is currently estimated at $275,553, approximately $154 per square foot. 355 Mound Rd is a home located in Muskingum County with nearby schools including Philo High School.
Ownership History
Date
Name
Owned For
Owner Type
Purchase Details
Closed on
Dec 4, 2006
Sold by
Powers Tyson M and Powers Lori A
Bought by
Stutes Jason B and Stutes Sadie K
Current Estimated Value
Home Financials for this Owner
Home Financials are based on the most recent Mortgage that was taken out on this home.
Original Mortgage
$10,125
Outstanding Balance
$6,060
Interest Rate
6.33%
Mortgage Type
Purchase Money Mortgage
Estimated Equity
$269,493
Purchase Details
Closed on
Aug 7, 2001
Sold by
Kennedy Andrew
Bought by
Powers Tyson M and Powers Lori A
Purchase Details
Closed on
Mar 10, 1997
Sold by
Kennedy Benjamin
Bought by
Kennedy Andrew and Kennedy Vickie
Home Financials for this Owner
Home Financials are based on the most recent Mortgage that was taken out on this home.
Original Mortgage
$60,000
Interest Rate
11.88%
Mortgage Type
New Conventional
Create a Home Valuation Report for This Property
The Home Valuation Report is an in-depth analysis detailing your home's value as well as a comparison with similar homes in the area
Purchase History
| Date | Buyer | Sale Price | Title Company |
|---|---|---|---|
| Stutes Jason B | $11,000 | Attorney | |
| Powers Tyson M | $76,000 | -- | |
| Kennedy Andrew | $42,250 | -- |
Source: Public Records
Mortgage History
| Date | Status | Borrower | Loan Amount |
|---|---|---|---|
| Open | Stutes Jason B | $10,125 | |
| Previous Owner | Kennedy Andrew | $60,000 | |
| Closed | Powers Tyson M | -- |
Source: Public Records
Tax History
| Year | Tax Paid | Tax Assessment Tax Assessment Total Assessment is a certain percentage of the fair market value that is determined by local assessors to be the total taxable value of land and additions on the property. | Land | Improvement |
|---|---|---|---|---|
| 2024 | $1,905 | $59,150 | $6,720 | $52,430 |
| 2023 | $1,511 | $44,555 | $4,725 | $39,830 |
| 2022 | $1,450 | $44,555 | $4,725 | $39,830 |
| 2021 | $1,427 | $44,555 | $4,725 | $39,830 |
| 2020 | $1,326 | $40,530 | $4,305 | $36,225 |
| 2019 | $1,323 | $40,530 | $4,305 | $36,225 |
| 2018 | $1,247 | $40,530 | $4,305 | $36,225 |
| 2017 | $1,156 | $32,375 | $4,305 | $28,070 |
| 2016 | $1,110 | $32,380 | $4,310 | $28,070 |
| 2015 | $1,141 | $32,380 | $4,310 | $28,070 |
| 2013 | $1,042 | $23,700 | $4,310 | $19,390 |
Source: Public Records
Map
Nearby Homes
- 243 Mill St
- 512 North St
- 606 Main St
- 134 Main St
- 307 Harris St
- 524 Spring St
- 3100 Durant Rd
- 3345 Durant Rd
- 0 Durant Rd Unit 5186947
- 4145 Old River Rd
- 0 Sealover Hollow Rd
- 1685 Fattler Ridge Rd
- 6965 Chandlersville Rd
- 2519 Frick Dr
- 2630 Glenn Cir
- 3010 Corbin Dr
- 3010 S River Rd
- 7979 Old River Rd
- 8285 Old River Rd
- 2465 Clay Pike
Your Personal Tour Guide
Ask me questions while you tour the home.