Estimated Value: $273,000 - $318,000
2
Beds
2
Baths
1,400
Sq Ft
$204/Sq Ft
Est. Value
About This Home
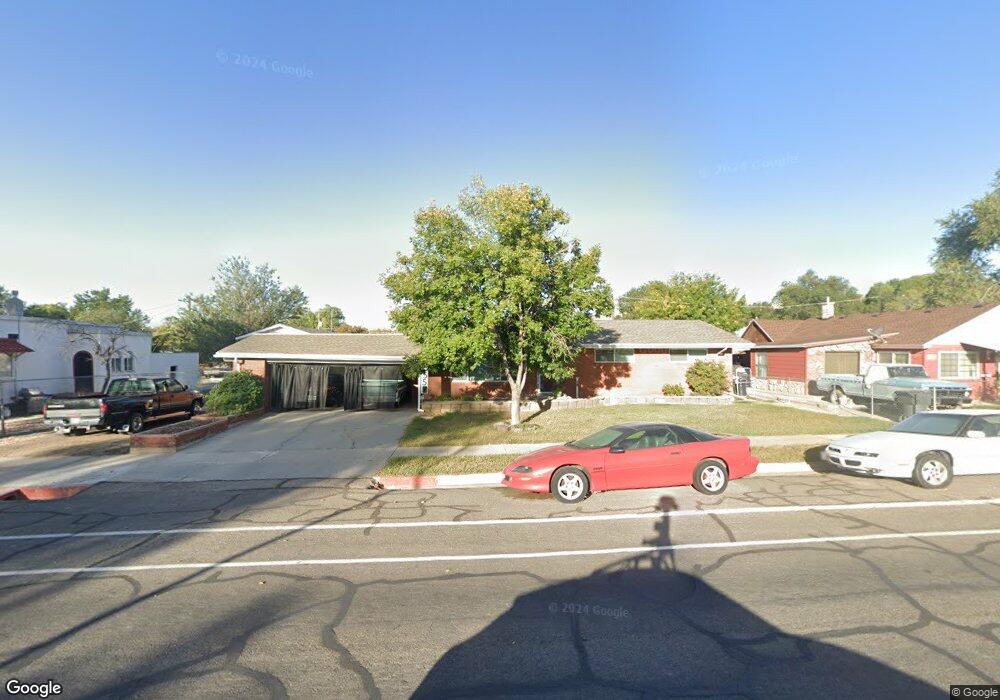
This home is located at 355 N 400 E, Price, UT 84501 and is currently estimated at $286,100, approximately $204 per square foot. 355 N 400 E is a home located in Carbon County with nearby schools including Castle Heights School, Mont Harmon Junior High School, and Carbon High School.
Ownership History
Date
Name
Owned For
Owner Type
Purchase Details
Closed on
Oct 18, 2023
Sold by
Rea Gary Shane and Rea Jaylynn
Bought by
Rea Family Trust and Rea
Current Estimated Value
Purchase Details
Closed on
Jun 16, 2020
Sold by
Engle William Clark and Engle Laurie
Bought by
Rea Gary Shane and Rea Jaylynn
Purchase Details
Closed on
Oct 12, 2010
Sold by
Engle William Clark
Bought by
Engle William Clark and Engle Laurie
Purchase Details
Closed on
May 25, 2005
Sold by
Simmons Timothy H and Simmons Diane P
Bought by
Engle William Clark
Create a Home Valuation Report for This Property
The Home Valuation Report is an in-depth analysis detailing your home's value as well as a comparison with similar homes in the area
Purchase History
| Date | Buyer | Sale Price | Title Company |
|---|---|---|---|
| Rea Family Trust | -- | None Listed On Document | |
| Rea Gary Shane | -- | Professional Title Services | |
| Engle William Clark | -- | Professional Title Services | |
| Engle William Clark | -- | Emery County Abstract & Titl |
Source: Public Records
Tax History
| Year | Tax Paid | Tax Assessment Tax Assessment Total Assessment is a certain percentage of the fair market value that is determined by local assessors to be the total taxable value of land and additions on the property. | Land | Improvement |
|---|---|---|---|---|
| 2025 | $1,432 | $117,838 | $13,634 | $104,204 |
| 2024 | $1,407 | $117,119 | $12,788 | $104,331 |
| 2023 | $1,426 | $126,657 | $13,026 | $113,631 |
| 2022 | $1,424 | $113,403 | $10,830 | $102,573 |
| 2021 | $1,227 | $151,690 | $16,547 | $135,143 |
| 2020 | $1,205 | $74,744 | $0 | $0 |
| 2019 | $1,073 | $69,837 | $0 | $0 |
| 2018 | $996 | $66,123 | $0 | $0 |
| 2017 | $984 | $66,123 | $0 | $0 |
| 2016 | $888 | $66,123 | $0 | $0 |
| 2015 | $888 | $66,123 | $0 | $0 |
| 2014 | $882 | $66,123 | $0 | $0 |
| 2013 | $867 | $64,431 | $0 | $0 |
Source: Public Records
Map
Nearby Homes
Your Personal Tour Guide
Ask me questions while you tour the home.