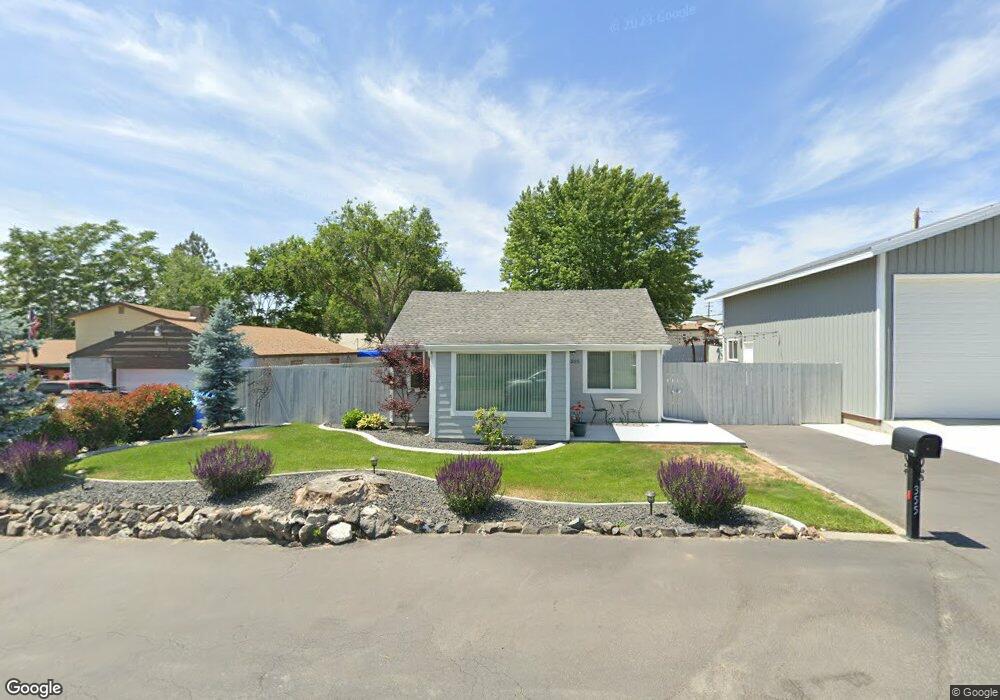
355 N 61st Ave West Richland, WA 99353
Estimated Value: $195,000 - $282,212
2
Beds
1
Bath
1,009
Sq Ft
$242/Sq Ft
Est. Value
About This Home
This home is located at 355 N 61st Ave, West Richland, WA 99353 and is currently estimated at $244,053, approximately $241 per square foot. 355 N 61st Ave is a home located in Benton County with nearby schools including Tapteal Elementary School, Hanford High School, and Liberty Christian School of the Tri-Cities.
Ownership History
Date
Name
Owned For
Owner Type
Purchase Details
Closed on
Sep 1, 2016
Sold by
Wells Fargo Bank Na
Bought by
Keck Jeff Denton and Keck Angelia Dawn
Current Estimated Value
Purchase Details
Closed on
May 12, 2016
Sold by
The Secretary Of Housing & Urban Develop
Bought by
Wells Fargo Bank Na
Purchase Details
Closed on
Jan 5, 2016
Sold by
Wells Fargo Bank Na
Bought by
Secretary Of Housing & Urban Development
Purchase Details
Closed on
Oct 26, 2015
Sold by
Wilson Guy E
Bought by
Wells Fargo Bank Na
Purchase Details
Closed on
Oct 3, 2008
Sold by
Graham Donald S and Graham Kandee J
Bought by
Wilson Guy E
Home Financials for this Owner
Home Financials are based on the most recent Mortgage that was taken out on this home.
Original Mortgage
$106,593
Interest Rate
6.43%
Mortgage Type
FHA
Create a Home Valuation Report for This Property
The Home Valuation Report is an in-depth analysis detailing your home's value as well as a comparison with similar homes in the area
Home Values in the Area
Average Home Value in this Area
Purchase History
| Date | Buyer | Sale Price | Title Company |
|---|---|---|---|
| Keck Jeff Denton | $74,007 | Tri City Title & Escrow | |
| Wells Fargo Bank Na | -- | Servicelink | |
| Secretary Of Housing & Urban Development | -- | Service Link | |
| Wells Fargo Bank Na | $88,480 | Frontier Title & Escrow Co | |
| Wilson Guy E | $108,000 | Chicago Title |
Source: Public Records
Mortgage History
| Date | Status | Borrower | Loan Amount |
|---|---|---|---|
| Previous Owner | Wilson Guy E | $106,593 |
Source: Public Records
Tax History Compared to Growth
Tax History
| Year | Tax Paid | Tax Assessment Tax Assessment Total Assessment is a certain percentage of the fair market value that is determined by local assessors to be the total taxable value of land and additions on the property. | Land | Improvement |
|---|---|---|---|---|
| 2024 | $2,362 | $180,980 | $40,000 | $140,980 |
| 2023 | $2,362 | $195,450 | $40,000 | $155,450 |
| 2022 | $1,943 | $148,450 | $40,000 | $108,450 |
| 2021 | $1,852 | $137,600 | $40,000 | $97,600 |
| 2020 | $1,909 | $126,760 | $40,000 | $86,760 |
| 2019 | $1,484 | $126,760 | $40,000 | $86,760 |
| 2018 | $1,666 | $102,140 | $28,000 | $74,140 |
| 2017 | $1,485 | $102,140 | $28,000 | $74,140 |
| 2016 | $707 | $102,140 | $28,000 | $74,140 |
| 2015 | $1,429 | $102,140 | $28,000 | $74,140 |
| 2014 | -- | $102,140 | $28,000 | $74,140 |
| 2013 | -- | $102,140 | $28,000 | $74,140 |
Source: Public Records
Map
Nearby Homes
- 3173 Belmont Blvd
- Lot 2 Belmont Blvd
- Lot 3 Belmont Blvd
- 6334 Hove St
- 5880 S 58th Ave
- 6504 James St
- 324 Mojave Ct
- 5830 Gray St
- 6408 Haag St
- 6511 James St
- 872 N 60th Ave
- 6504 Morrison St
- 961 N 60th Ave
- 6530 Meyers St Unit 103
- 5120 Collins Rd
- 1082 N 61st Ave
- 104 N 68th Ave
- 201 N 69th Ave
- 5900 Everett St
- 5404 Collins Rd
- 323 N 61st Ave
- 6129 Deer St
- 338 Glenn Hill Ave
- 340 Glenn Hill Ave
- 356 N 61st Ave
- 356 N 61st Ave Unit Super Clean with Sho
- 362 N 61st Ave
- 6106 Desert View Dr
- 6085 Deer St
- 6120 Deer St
- 6074 Desert View Dr
- 6112 W van Giesen St
- 357 Glenn Hill Ave
- 389 Glenn Hill Ave
- 335 Glenn Hill Ave
- 460 Glenn Hill Ave
- 6080 Deer St
- 6084 W van Giesen St
- 6162 Desert View Dr
- 6067 Deer St