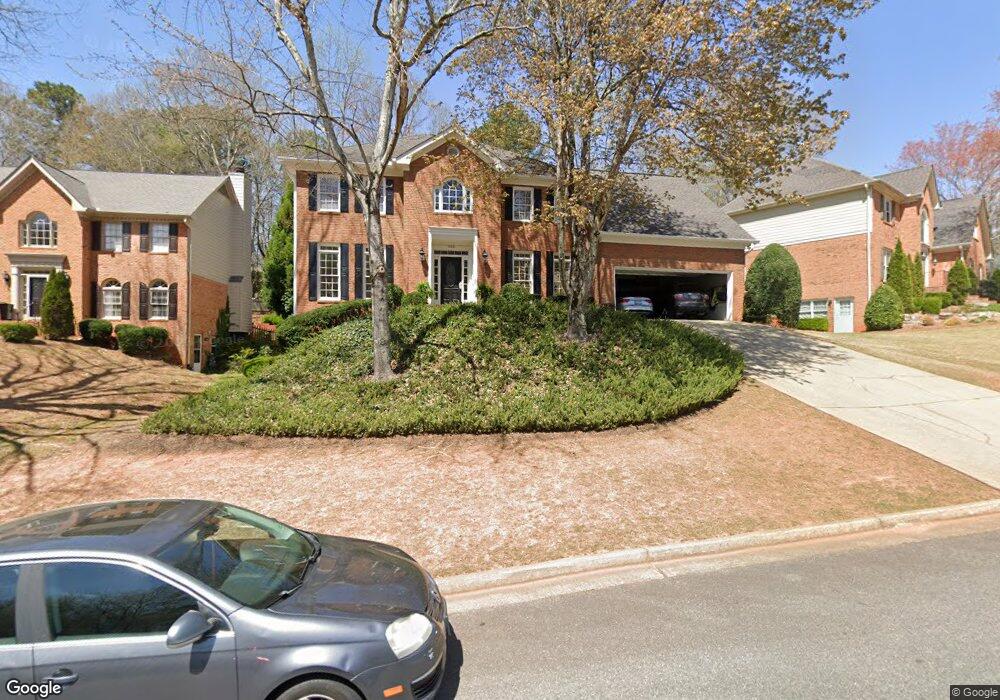
355 Rosalie Ct Unit II Alpharetta, GA 30022
Estimated Value: $763,000 - $996,000
4
Beds
3
Baths
3,336
Sq Ft
$252/Sq Ft
Est. Value
About This Home
This home is located at 355 Rosalie Ct Unit II, Alpharetta, GA 30022 and is currently estimated at $842,084, approximately $252 per square foot. 355 Rosalie Ct Unit II is a home located in Fulton County with nearby schools including Ocee Elementary School, Taylor Road Middle School, and Chattahoochee High School.
Ownership History
Date
Name
Owned For
Owner Type
Purchase Details
Closed on
Jan 5, 2000
Sold by
Perez Isvaldo and Perez Michele M
Bought by
Szumowski Kathryn L and Szumowski John E
Current Estimated Value
Home Financials for this Owner
Home Financials are based on the most recent Mortgage that was taken out on this home.
Original Mortgage
$269,550
Outstanding Balance
$77,030
Interest Rate
6.5%
Mortgage Type
New Conventional
Estimated Equity
$765,054
Purchase Details
Closed on
Oct 28, 1996
Sold by
Ricci Joseph S Patricia
Bought by
Perez Isvaldo
Purchase Details
Closed on
Dec 22, 1994
Sold by
Vance Ronald A Melissa D
Bought by
Ricci Joseph S
Home Financials for this Owner
Home Financials are based on the most recent Mortgage that was taken out on this home.
Original Mortgage
$223,155
Interest Rate
8.62%
Create a Home Valuation Report for This Property
The Home Valuation Report is an in-depth analysis detailing your home's value as well as a comparison with similar homes in the area
Home Values in the Area
Average Home Value in this Area
Purchase History
| Date | Buyer | Sale Price | Title Company |
|---|---|---|---|
| Szumowski Kathryn L | $298,500 | -- | |
| Perez Isvaldo | $235,000 | -- | |
| Ricci Joseph S | $234,900 | -- |
Source: Public Records
Mortgage History
| Date | Status | Borrower | Loan Amount |
|---|---|---|---|
| Open | Szumowski Kathryn L | $269,550 | |
| Previous Owner | Ricci Joseph S | $223,155 | |
| Closed | Perez Isvaldo | $0 |
Source: Public Records
Tax History Compared to Growth
Tax History
| Year | Tax Paid | Tax Assessment Tax Assessment Total Assessment is a certain percentage of the fair market value that is determined by local assessors to be the total taxable value of land and additions on the property. | Land | Improvement |
|---|---|---|---|---|
| 2025 | $863 | $311,080 | $89,800 | $221,280 |
| 2023 | $7,727 | $273,760 | $65,520 | $208,240 |
| 2022 | $4,058 | $206,520 | $44,520 | $162,000 |
| 2021 | $4,766 | $181,160 | $43,240 | $137,920 |
| 2020 | $4,794 | $179,080 | $42,760 | $136,320 |
| 2019 | $730 | $181,280 | $39,960 | $141,320 |
| 2018 | $4,387 | $177,000 | $39,000 | $138,000 |
| 2017 | $4,008 | $150,200 | $23,920 | $126,280 |
| 2016 | $3,946 | $150,200 | $23,920 | $126,280 |
| 2015 | $4,624 | $150,200 | $23,920 | $126,280 |
| 2014 | $3,760 | $135,400 | $26,680 | $108,720 |
Source: Public Records
Map
Nearby Homes
- 710 Country Manor Way
- 10530 Tuxford Dr
- 125 Sandridge Ct
- 10880 Windham Way
- 465 Kirkstall Trail
- 610 Varina Way
- 285 Rolling Mist Ct
- 10845 Carrissa Trail
- 345 Kincardine Way Unit IIIA
- 825 Highland Bend Cove
- 105 Kimball Bridge Cove
- 10515 Colony Glen Dr Unit 2
- 120 Thome Dr
- 235 Wood Shoals Ct
- 3962 Erin Dr
- 415 Wood Trace Ct
- 10415 Plantation Bridge Dr
- 365 Rosalie Ct
- 345 Rosalie Ct
- 335 Rosalie Ct
- 325 Rosalie Ct
- 375 Rosalie Ct
- 315 Rosalie Ct Unit 2
- 0 Rosalie Ct Unit 7399401
- 0 Rosalie Ct Unit 8040376
- 0 Rosalie Ct Unit 8025692
- 0 Rosalie Ct Unit 8282484
- 0 Rosalie Ct Unit 8213289
- 0 Rosalie Ct Unit 8036499
- 0 Rosalie Ct Unit 3234802
- 0 Rosalie Ct Unit 7085170
- 10705 Dunoon Dr
- 390 Rosalie Ct
- 400 Rosalie Ct
- 10695 Dunoon Dr
- 370 Rosalie Ct Unit 2
- 305 Rosalie Ct