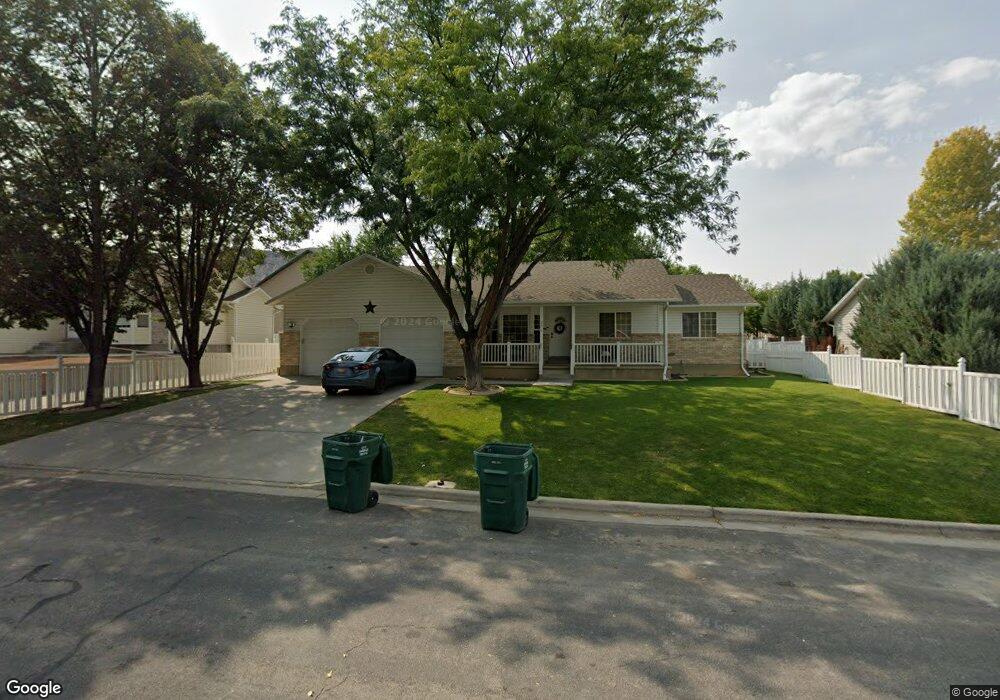
355 S 3290 W Vernal, UT 84078
Estimated Value: $361,548 - $436,000
--
Bed
--
Bath
1,634
Sq Ft
$245/Sq Ft
Est. Value
About This Home
This home is located at 355 S 3290 W, Vernal, UT 84078 and is currently estimated at $400,887, approximately $245 per square foot. 355 S 3290 W is a home located in Uintah County with nearby schools including Maeser School, Vernal Middle School, and Uintah Middle School.
Ownership History
Date
Name
Owned For
Owner Type
Purchase Details
Closed on
Jan 3, 2024
Sold by
Henline Hailey
Bought by
Henline Nicolas
Current Estimated Value
Home Financials for this Owner
Home Financials are based on the most recent Mortgage that was taken out on this home.
Original Mortgage
$50,000
Outstanding Balance
$49,180
Interest Rate
7.29%
Mortgage Type
New Conventional
Estimated Equity
$351,707
Purchase Details
Closed on
Mar 22, 2021
Sold by
Henline Nicols
Bought by
Henline Nicolas
Purchase Details
Closed on
Jan 24, 2011
Sold by
Henline Dustin and Henline Lynette A
Bought by
Henline Dustin S and Henline Lynette A
Home Financials for this Owner
Home Financials are based on the most recent Mortgage that was taken out on this home.
Original Mortgage
$124,500
Interest Rate
4.82%
Mortgage Type
New Conventional
Create a Home Valuation Report for This Property
The Home Valuation Report is an in-depth analysis detailing your home's value as well as a comparison with similar homes in the area
Home Values in the Area
Average Home Value in this Area
Purchase History
| Date | Buyer | Sale Price | Title Company |
|---|---|---|---|
| Henline Nicolas | -- | Basin Land Title | |
| Henline Nicolas | -- | None Available | |
| Henline Dustin S | -- | -- |
Source: Public Records
Mortgage History
| Date | Status | Borrower | Loan Amount |
|---|---|---|---|
| Open | Henline Nicolas | $50,000 | |
| Previous Owner | Henline Dustin S | $124,500 |
Source: Public Records
Tax History Compared to Growth
Tax History
| Year | Tax Paid | Tax Assessment Tax Assessment Total Assessment is a certain percentage of the fair market value that is determined by local assessors to be the total taxable value of land and additions on the property. | Land | Improvement |
|---|---|---|---|---|
| 2024 | $2,101 | $244,696 | $14,616 | $230,080 |
| 2023 | $2,056 | $215,523 | $14,616 | $200,907 |
| 2022 | $1,712 | $165,923 | $22,000 | $143,923 |
| 2021 | $1,701 | $74,424 | $10,588 | $63,837 |
| 2020 | $1,657 | $135,317 | $19,250 | $116,067 |
| 2019 | $1,677 | $135,317 | $19,250 | $116,067 |
| 2018 | $1,606 | $129,790 | $19,250 | $110,540 |
| 2017 | $16 | $133,361 | $19,250 | $114,111 |
| 2016 | $1,542 | $136,890 | $19,250 | $117,640 |
| 2015 | $1,421 | $136,890 | $19,250 | $117,640 |
| 2014 | $1,404 | $136,890 | $19,250 | $117,640 |
| 2013 | $1,435 | $136,890 | $19,250 | $117,640 |
Source: Public Records
Map
Nearby Homes
- 373 S 3240 W
- 3017 W 250 S Unit 407
- 3193 W 440 S
- 3019 W 250 S Unit 408
- 3438 W 500 S
- 486 N 3500 W
- 3543 W 700 N
- 4181 W Delray Rd
- 4190 W Delray Rd Unit 39
- 2690 W 500 N
- 2230 W 700 S Unit 2236
- 604 S 2150 W
- 1566 S 3280 W
- 521 N 2400 W
- 1559 S 2950 W
- 631 N 4250 W
- 3227 W 1750 S
- 689 N 4250 W
- 2849 W 1800 S
- 1601 W 300 S Unit 57