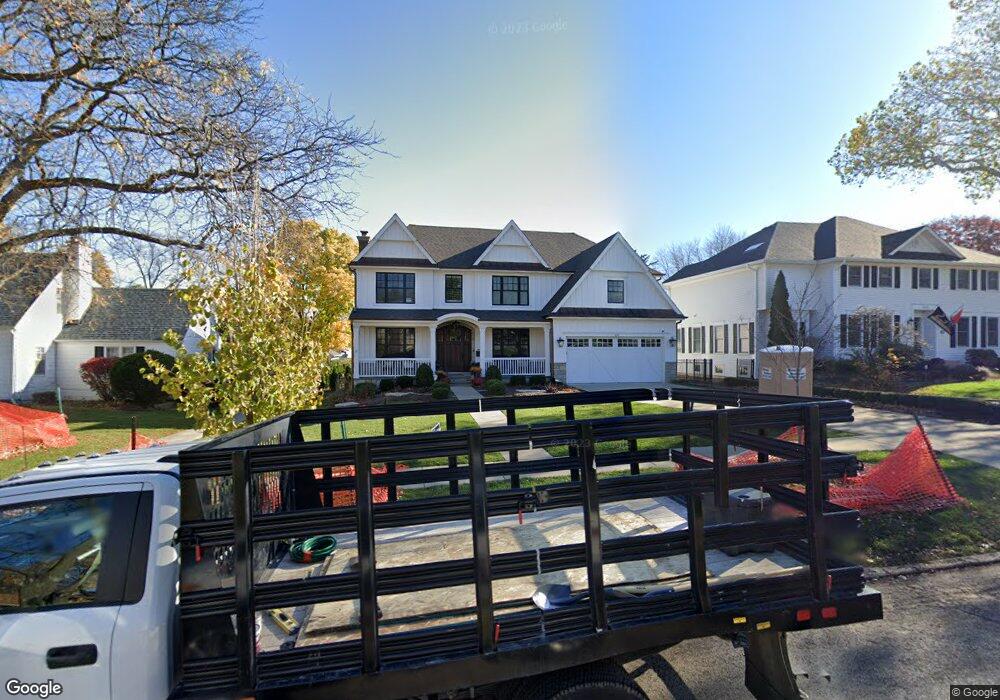
355 Spring Ave Glen Ellyn, IL 60137
Estimated Value: $1,539,000 - $1,614,000
4
Beds
4
Baths
3,824
Sq Ft
$412/Sq Ft
Est. Value
About This Home
This home is located at 355 Spring Ave, Glen Ellyn, IL 60137 and is currently estimated at $1,576,839, approximately $412 per square foot. 355 Spring Ave is a home located in DuPage County with nearby schools including Benjamin Franklin Elementary School, Hadley Junior High School, and Glenbard West High School.
Ownership History
Date
Name
Owned For
Owner Type
Purchase Details
Closed on
May 29, 2019
Sold by
Adams Bradley and Adams Jacqueline
Bought by
Adams Bradley S and Adams Jacqueline M
Current Estimated Value
Purchase Details
Closed on
Jul 3, 2017
Sold by
Jrh Properties Llc
Bought by
Adams Bradley and Adams Jacqueline
Purchase Details
Closed on
May 21, 2015
Sold by
355 Spring Avenue Llc
Bought by
Jrh Properties
Purchase Details
Closed on
Oct 30, 2007
Sold by
King Keith N and King Bonnie L
Bought by
355 Spring Avenue Llc
Purchase Details
Closed on
Jun 15, 2007
Sold by
Vetrovec Margaret H
Bought by
King Keith N and King Bonnie L
Create a Home Valuation Report for This Property
The Home Valuation Report is an in-depth analysis detailing your home's value as well as a comparison with similar homes in the area
Home Values in the Area
Average Home Value in this Area
Purchase History
| Date | Buyer | Sale Price | Title Company |
|---|---|---|---|
| Adams Bradley S | -- | Attorney | |
| Adams Bradley | $1,156,400 | Chicago Title Insurance Comp | |
| Jrh Properties | $310,000 | Fort Dearborn Title | |
| 355 Spring Avenue Llc | $327,000 | First American Title Ins Co | |
| King Keith N | $344,000 | None Available |
Source: Public Records
Tax History
| Year | Tax Paid | Tax Assessment Tax Assessment Total Assessment is a certain percentage of the fair market value that is determined by local assessors to be the total taxable value of land and additions on the property. | Land | Improvement |
|---|---|---|---|---|
| 2024 | $33,722 | $487,109 | $46,215 | $440,894 |
| 2023 | $32,300 | $448,370 | $42,540 | $405,830 |
| 2022 | $30,658 | $415,470 | $40,200 | $375,270 |
| 2021 | $28,894 | $405,620 | $39,250 | $366,370 |
| 2020 | $28,329 | $401,840 | $38,880 | $362,960 |
| 2019 | $27,715 | $391,230 | $37,850 | $353,380 |
| 2018 | $28,316 | $396,180 | $41,200 | $354,980 |
| 2017 | $28,152 | $374,080 | $39,690 | $334,390 |
| 2016 | $5,834 | $72,730 | $38,100 | $34,630 |
| 2015 | $6,798 | $80,870 | $36,350 | $44,520 |
| 2014 | $6,136 | $70,350 | $25,540 | $44,810 |
| 2013 | $5,973 | $70,560 | $25,620 | $44,940 |
Source: Public Records
Map
Nearby Homes
- 291 Spring Ave
- 345 Woodstock Ave
- 255 Grandview Ave
- 326 Indian Dr
- 235 Cumnor Ave
- 240 Scott Ave
- 297 Van Damin Ave
- 734 Highview Ave
- 275 Merton Ave
- 490 Carleton Ave
- 134 Woodview Ct
- 102 Grove Ave
- 621 W Wilson Ave
- 701 Willis St
- 579 Lee St
- 563 Taylor Ave
- 445 N Park Blvd Unit 3F
- 441 N Park Blvd Unit 4B
- 441 N Park Blvd Unit 5K
- 861 Crescent Blvd
Your Personal Tour Guide
Ask me questions while you tour the home.