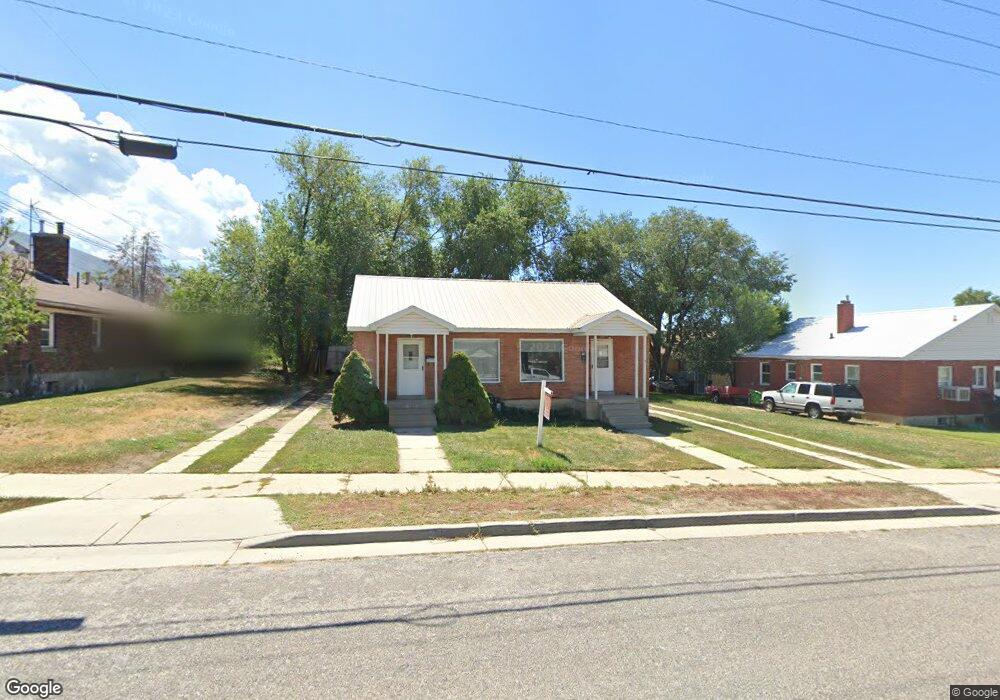
355 W 100 S Brigham City, UT 84302
Estimated Value: $347,000 - $443,000
1
Bed
1
Bath
2,660
Sq Ft
$148/Sq Ft
Est. Value
About This Home
This home is located at 355 W 100 S, Brigham City, UT 84302 and is currently estimated at $394,947, approximately $148 per square foot. 355 W 100 S is a home located in Box Elder County with nearby schools including Lake View Elementary School, Box Elder Middle School, and Adele C. Young Intermediate School.
Ownership History
Date
Name
Owned For
Owner Type
Purchase Details
Closed on
Dec 20, 2023
Sold by
Frost Family Trust
Bought by
Coppieters Aaron and Coppieters Landon J
Current Estimated Value
Home Financials for this Owner
Home Financials are based on the most recent Mortgage that was taken out on this home.
Original Mortgage
$329,900
Outstanding Balance
$324,424
Interest Rate
7.5%
Mortgage Type
New Conventional
Estimated Equity
$70,523
Create a Home Valuation Report for This Property
The Home Valuation Report is an in-depth analysis detailing your home's value as well as a comparison with similar homes in the area
Home Values in the Area
Average Home Value in this Area
Purchase History
| Date | Buyer | Sale Price | Title Company |
|---|---|---|---|
| Coppieters Aaron | -- | Us Title Insurance Agency |
Source: Public Records
Mortgage History
| Date | Status | Borrower | Loan Amount |
|---|---|---|---|
| Open | Coppieters Aaron | $329,900 |
Source: Public Records
Tax History Compared to Growth
Tax History
| Year | Tax Paid | Tax Assessment Tax Assessment Total Assessment is a certain percentage of the fair market value that is determined by local assessors to be the total taxable value of land and additions on the property. | Land | Improvement |
|---|---|---|---|---|
| 2025 | $1,987 | $341,687 | $104,000 | $237,687 |
| 2024 | $1,728 | $332,684 | $99,000 | $233,684 |
| 2023 | $1,781 | $350,963 | $94,000 | $256,963 |
| 2022 | $1,458 | $267,239 | $39,000 | $228,239 |
| 2021 | $1,332 | $186,298 | $39,000 | $147,298 |
| 2020 | $1,147 | $186,298 | $39,000 | $147,298 |
| 2019 | $1,077 | $93,144 | $21,450 | $71,694 |
| 2018 | $975 | $96,072 | $21,450 | $74,622 |
| 2017 | $849 | $126,386 | $8,470 | $110,986 |
| 2016 | $885 | $66,606 | $8,470 | $58,136 |
| 2015 | $811 | $61,321 | $8,470 | $52,851 |
| 2014 | $811 | $58,804 | $8,470 | $50,334 |
| 2013 | -- | $58,804 | $8,470 | $50,334 |
Source: Public Records
Map
Nearby Homes
- 423 W Forest St
- 526 W 200 S
- 512 W 300 S
- 315 S 500 W
- 15 S 100 E
- 472 S 300 W
- 410 S 100 E
- 1158 W 500 S
- 1177 W 500 S Unit 22
- 217 N 100 W
- 345 S 200 E
- 515 S 700 W
- 562 S 300 W
- 451 S 200 E
- 682 N 300 W
- 1125 W 500 S Unit LOT 34
- 1174 W 500 S
- 1182 W 500 S
- Lapis Plan at Beeton Path - Seasons
- Coral Plan at Beeton Path - Seasons