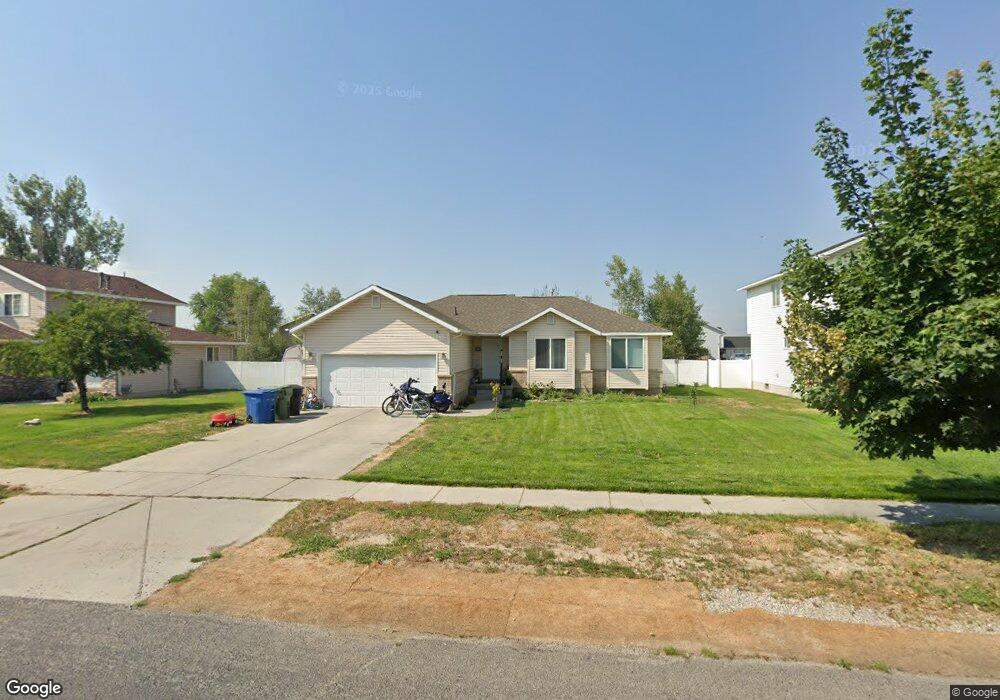
355 W 1330 N Logan, UT 84341
Bridger NeighborhoodEstimated Value: $358,000 - $398,000
3
Beds
2
Baths
1,274
Sq Ft
$293/Sq Ft
Est. Value
About This Home
This home is located at 355 W 1330 N, Logan, UT 84341 and is currently estimated at $373,440, approximately $293 per square foot. 355 W 1330 N is a home located in Cache County with nearby schools including Bridger School, Mount Logan Middle School, and Logan High School.
Ownership History
Date
Name
Owned For
Owner Type
Purchase Details
Closed on
Sep 13, 2021
Sold by
Pitcher Ruth W
Bought by
Robert J Pitcher Family Trust
Current Estimated Value
Home Financials for this Owner
Home Financials are based on the most recent Mortgage that was taken out on this home.
Original Mortgage
$328,932
Outstanding Balance
$297,996
Interest Rate
2.8%
Mortgage Type
FHA
Estimated Equity
$75,444
Purchase Details
Closed on
Sep 10, 2021
Sold by
Robert J Pitcher Family Trust and Pitcher Ted Alan
Bought by
Acosta Agustin Rodriguez
Home Financials for this Owner
Home Financials are based on the most recent Mortgage that was taken out on this home.
Original Mortgage
$328,932
Outstanding Balance
$297,996
Interest Rate
2.8%
Mortgage Type
FHA
Estimated Equity
$75,444
Purchase Details
Closed on
Nov 21, 2013
Sold by
Pitcher Robert J and Pitcher Ruth W
Bought by
Pitcher Robert J and Pitcher Ruth W
Create a Home Valuation Report for This Property
The Home Valuation Report is an in-depth analysis detailing your home's value as well as a comparison with similar homes in the area
Home Values in the Area
Average Home Value in this Area
Purchase History
| Date | Buyer | Sale Price | Title Company |
|---|---|---|---|
| Robert J Pitcher Family Trust | -- | -- | |
| Acosta Agustin Rodriguez | -- | Advanced Title | |
| Pitcher Robert J | -- | None Available |
Source: Public Records
Mortgage History
| Date | Status | Borrower | Loan Amount |
|---|---|---|---|
| Open | Acosta Agustin Rodriguez | $328,932 |
Source: Public Records
Tax History
| Year | Tax Paid | Tax Assessment Tax Assessment Total Assessment is a certain percentage of the fair market value that is determined by local assessors to be the total taxable value of land and additions on the property. | Land | Improvement |
|---|---|---|---|---|
| 2025 | $1,707 | $220,825 | $0 | $0 |
| 2024 | $1,763 | $220,825 | $0 | $0 |
| 2023 | $1,839 | $219,615 | $0 | $0 |
| 2022 | $1,649 | $183,865 | $0 | $0 |
| 2021 | $1,446 | $249,120 | $45,000 | $204,120 |
| 2020 | $1,265 | $196,168 | $45,000 | $151,168 |
| 2019 | $1,323 | $196,167 | $45,000 | $151,167 |
| 2018 | $1,303 | $176,450 | $45,000 | $131,450 |
| 2017 | $1,225 | $87,725 | $0 | $0 |
| 2016 | $1,270 | $78,980 | $0 | $0 |
| 2015 | $1,074 | $74,070 | $0 | $0 |
| 2014 | $971 | $74,070 | $0 | $0 |
| 2013 | -- | $74,070 | $0 | $0 |
Source: Public Records
Map
Nearby Homes
- 2200 N 220 W
- 1515 N 450 W Unit 103
- 1368 N 590 W
- 1555 N 280 W Unit 102
- 1492 N 565 W Unit 103
- 723 W 1400 N Unit 3
- 519 W 1570 N Unit 103
- 1593 N 160 W Unit 201
- 1030 N 250 W
- 948 N 480 W
- 49 Kensington Place
- 2 Somerset Place
- 54 Kensington Place
- 897 N 250 W
- 905 N 540 W
- 1852 N 340 W
- 430 W 810 N
- 1926 Lavender Loop Unit 6
- 1903 N 300 W
- 111 Kings Ct
Your Personal Tour Guide
Ask me questions while you tour the home.