Estimated Value: $784,000 - $955,000
Studio
--
Bath
3,598
Sq Ft
$235/Sq Ft
Est. Value
About This Home
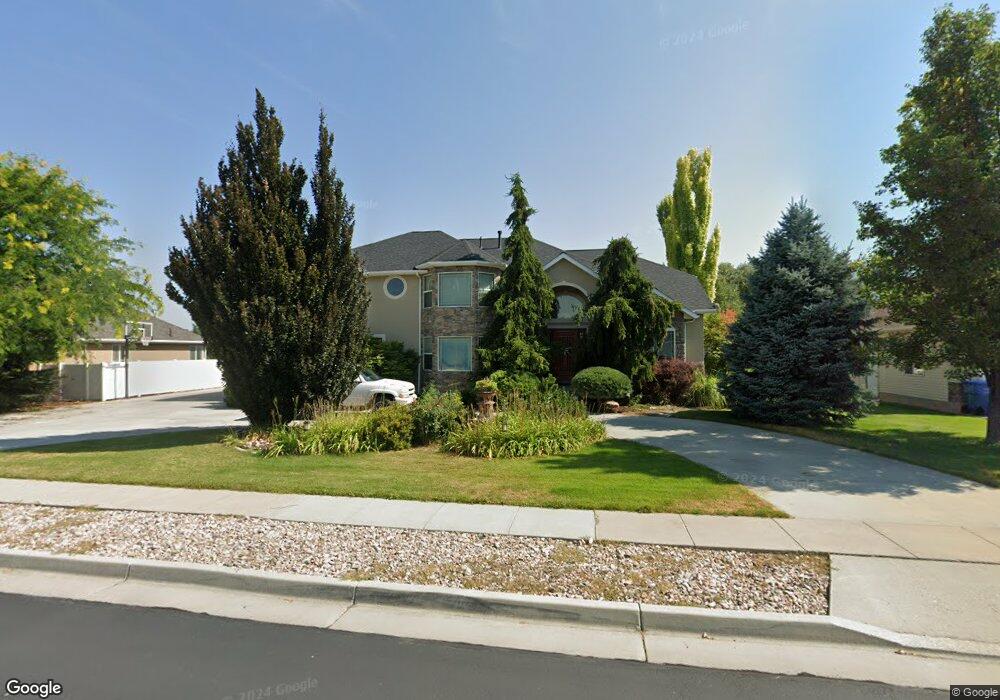
This home is located at 355 W 3575 S, Logan, UT 84321 and is currently estimated at $845,125, approximately $234 per square foot. 355 W 3575 S is a home with nearby schools including Heritage School, Spring Creek Middle School, and South Cache Middle School.
Ownership History
Date
Name
Owned For
Owner Type
Purchase Details
Closed on
Mar 4, 2013
Sold by
Hickman John Bryan and Hickman Heidi L
Bought by
Hickman John Bryan and Hickman Heidi Lee
Current Estimated Value
Home Financials for this Owner
Home Financials are based on the most recent Mortgage that was taken out on this home.
Original Mortgage
$336,000
Outstanding Balance
$233,949
Interest Rate
3.4%
Mortgage Type
New Conventional
Estimated Equity
$611,176
Purchase Details
Closed on
Dec 19, 2001
Sold by
Mccowin Bernice
Bought by
Hickman John Bryan and Hickman Heidi L
Home Financials for this Owner
Home Financials are based on the most recent Mortgage that was taken out on this home.
Original Mortgage
$32,000
Interest Rate
6.39%
Mortgage Type
Seller Take Back
Create a Home Valuation Report for This Property
The Home Valuation Report is an in-depth analysis detailing your home's value as well as a comparison with similar homes in the area
Home Values in the Area
Average Home Value in this Area
Purchase History
| Date | Buyer | Sale Price | Title Company |
|---|---|---|---|
| Hickman John Bryan | -- | Cache Title Logan | |
| Hickman John Bryan | -- | American Secure Title |
Source: Public Records
Mortgage History
| Date | Status | Borrower | Loan Amount |
|---|---|---|---|
| Open | Hickman John Bryan | $336,000 | |
| Closed | Hickman John Bryan | $32,000 |
Source: Public Records
Tax History
| Year | Tax Paid | Tax Assessment Tax Assessment Total Assessment is a certain percentage of the fair market value that is determined by local assessors to be the total taxable value of land and additions on the property. | Land | Improvement |
|---|---|---|---|---|
| 2025 | $3,318 | $439,805 | $0 | $0 |
| 2024 | $3,540 | $440,595 | $0 | $0 |
| 2023 | $3,731 | $434,755 | $0 | $0 |
| 2022 | $3,883 | $434,755 | $0 | $0 |
| 2021 | $3,720 | $646,770 | $72,000 | $574,770 |
| 2020 | $3,477 | $575,597 | $72,000 | $503,597 |
| 2019 | $3,647 | $575,596 | $72,000 | $503,596 |
| 2018 | $3,169 | $487,910 | $50,000 | $437,910 |
| 2017 | $3,022 | $246,455 | $0 | $0 |
| 2016 | $3,055 | $246,455 | $0 | $0 |
| 2015 | $2,589 | $210,165 | $0 | $0 |
| 2014 | $2,530 | $210,165 | $0 | $0 |
| 2013 | -- | $214,840 | $0 | $0 |
Source: Public Records
Map
Nearby Homes
- 396 W 3650 S
- 278 W 3400 S Unit 10
- 294 W 3400 S Unit 9
- 338 W 3400 S Unit 6
- 267 W 2975 S Unit 726
- 268 W 3400 S Unit 5
- 3923 Hillside Dr
- 186 W 3175 S
- 186 W 3175 S Unit 617
- 271 W 2975 S Unit 725
- 178 W 3175 S
- 174 W 3175 S
- 174 W 3175 S Unit 620
- 3107 S 400 W
- 3085 225 West G204
- 3085 S 225 West G302
- 3085 225 West G304
- 3085 S 225 W Unit G202
- 3085 S 225 W Unit G301
- 3085 S 225 W Unit 304
- 337 W 3575 S
- 364 W 3575 S
- 313 W 3575 S
- 397 W 3575 S
- 328 W 3515 S
- 328 W 3515 S Unit 6
- 316 W 3515 S Unit 5
- 348 W 3575 S
- 3580 S 400 W
- 304 W 3515 S
- 340 W 3515 S Unit 7
- 352 W 3515 S
- 292 W 3515 S Unit 3
- 287 W 3575 S
- 334 W 3575 S
- 417 W 3575 S
- 366 W 3515 S Unit 9
- 366 W 3515 S
- 278 W 3515 S Unit 2
- 278 W 3515 S
Your Personal Tour Guide
Ask me questions while you tour the home.