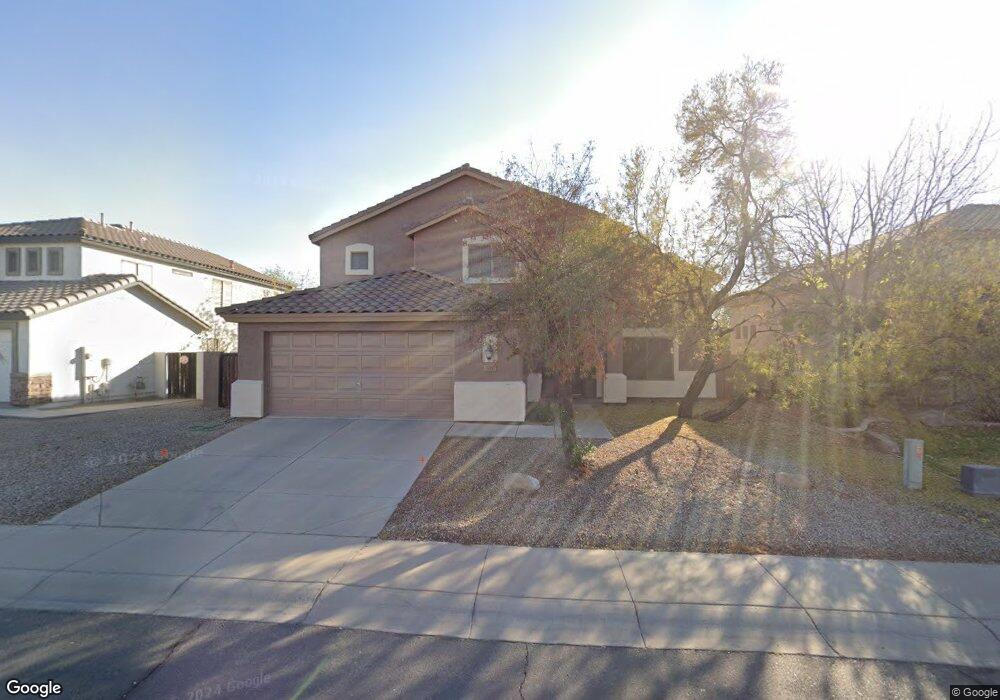
355 W Goldfinch Way Chandler, AZ 85286
Central Chandler NeighborhoodEstimated Value: $601,273 - $677,000
3
Beds
3
Baths
2,350
Sq Ft
$274/Sq Ft
Est. Value
About This Home
This home is located at 355 W Goldfinch Way, Chandler, AZ 85286 and is currently estimated at $643,568, approximately $273 per square foot. 355 W Goldfinch Way is a home located in Maricopa County with nearby schools including T. Dale Hancock Elementary School, Hamilton High School, and Bogle Junior High School.
Ownership History
Date
Name
Owned For
Owner Type
Purchase Details
Closed on
Mar 15, 2023
Sold by
Mclaughlin Cassandra Jean
Bought by
Mclaughlin Jack L and Mclaughlin Pamela L
Current Estimated Value
Purchase Details
Closed on
Jun 11, 2008
Sold by
Andrew Michael C and Andrew Kelly A
Bought by
Mclaughlin Cassandra Jean
Home Financials for this Owner
Home Financials are based on the most recent Mortgage that was taken out on this home.
Original Mortgage
$224,000
Interest Rate
5.99%
Mortgage Type
New Conventional
Purchase Details
Closed on
Sep 6, 2000
Sold by
Shea Homes Arizona Ltd Partnership
Bought by
Andrew Michael C and Andrew Kelly A
Home Financials for this Owner
Home Financials are based on the most recent Mortgage that was taken out on this home.
Original Mortgage
$179,250
Interest Rate
6.97%
Mortgage Type
New Conventional
Create a Home Valuation Report for This Property
The Home Valuation Report is an in-depth analysis detailing your home's value as well as a comparison with similar homes in the area
Home Values in the Area
Average Home Value in this Area
Purchase History
| Date | Buyer | Sale Price | Title Company |
|---|---|---|---|
| Mclaughlin Jack L | -- | -- | |
| Mclaughlin Cassandra Jean | $280,000 | Security Title Agency Inc | |
| Andrew Michael C | $192,774 | First American Title | |
| Shea Homes Arizona Ltd Partnership | -- | First American Title |
Source: Public Records
Mortgage History
| Date | Status | Borrower | Loan Amount |
|---|---|---|---|
| Previous Owner | Mclaughlin Cassandra Jean | $224,000 | |
| Previous Owner | Andrew Michael C | $179,250 |
Source: Public Records
Tax History Compared to Growth
Tax History
| Year | Tax Paid | Tax Assessment Tax Assessment Total Assessment is a certain percentage of the fair market value that is determined by local assessors to be the total taxable value of land and additions on the property. | Land | Improvement |
|---|---|---|---|---|
| 2025 | $2,861 | $36,724 | -- | -- |
| 2024 | $2,763 | $34,976 | -- | -- |
| 2023 | $2,763 | $45,850 | $9,170 | $36,680 |
| 2022 | $2,666 | $33,680 | $6,730 | $26,950 |
| 2021 | $2,794 | $32,230 | $6,440 | $25,790 |
| 2020 | $2,782 | $29,960 | $5,990 | $23,970 |
| 2019 | $2,675 | $28,680 | $5,730 | $22,950 |
| 2018 | $2,591 | $27,200 | $5,440 | $21,760 |
| 2017 | $2,415 | $25,650 | $5,130 | $20,520 |
| 2016 | $2,326 | $26,500 | $5,300 | $21,200 |
| 2015 | $2,254 | $23,620 | $4,720 | $18,900 |
Source: Public Records
Map
Nearby Homes
- 2861 S Illinois Place
- 633 W Canary Way
- 271 W Roadrunner Dr
- 634 W Goldfinch Way
- 563 W Bluejay Dr
- 642 W Crane Ct
- 250 W Queen Creek Rd Unit 204
- 250 W Queen Creek Rd Unit 206
- 250 W Queen Creek Rd Unit 101
- 250 W Queen Creek Rd Unit 106
- 250 W Queen Creek Rd Unit 131
- 250 W Queen Creek Rd Unit 249
- 180 W Roadrunner Dr
- 202 W Raven Dr
- 440 W Wisteria Place
- 402 W Lantana Place
- 443 W Lantana Place
- 3081 S Sunland Dr
- 821 W Oriole Way
- 705 W Queen Creek Rd Unit 2126
- 365 W Goldfinch Way
- 345 W Goldfinch Way
- 375 W Goldfinch Way
- 335 W Goldfinch Way
- 354 W Goldfinch Way
- 364 W Goldfinch Way
- 385 W Goldfinch Way
- 344 W Goldfinch Way
- 325 W Goldfinch Way
- 374 W Goldfinch Way
- 334 W Goldfinch Way
- 395 W Goldfinch Way
- 315 W Goldfinch Way
- 384 W Goldfinch Way
- 324 W Goldfinch Way
- 343 W Raven Dr Unit 44
- 343 W Raven Dr
- 353 W Raven Dr
- 333 W Raven Dr
- 314 W Goldfinch Way