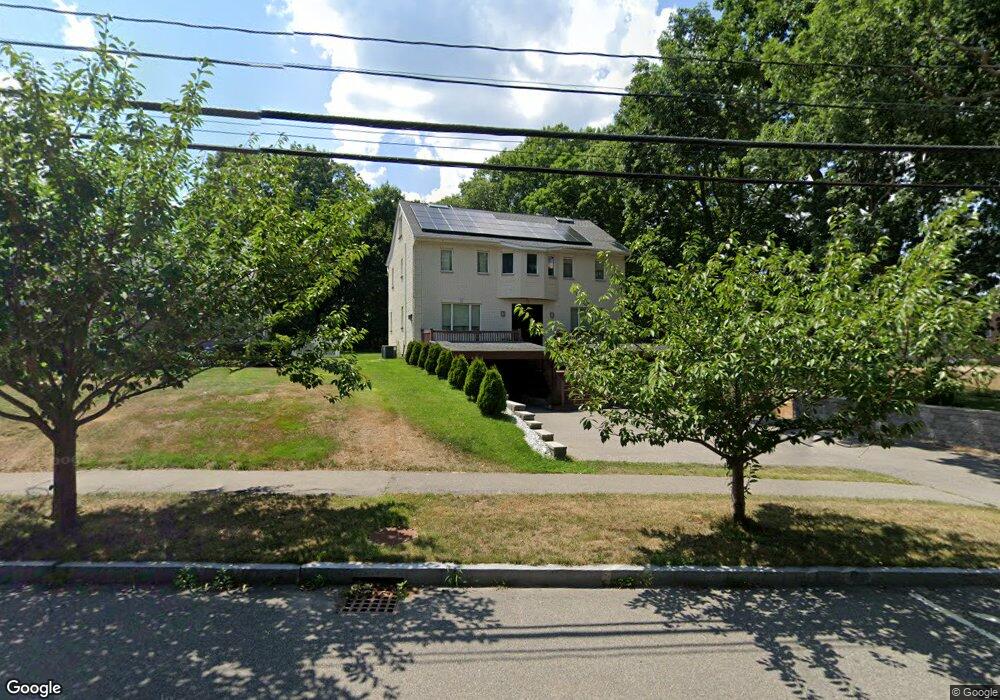
355 Webster St Needham Heights, MA 02494
Estimated Value: $1,677,000 - $2,104,000
4
Beds
4
Baths
4,339
Sq Ft
$426/Sq Ft
Est. Value
About This Home
This home is located at 355 Webster St, Needham Heights, MA 02494 and is currently estimated at $1,850,344, approximately $426 per square foot. 355 Webster St is a home located in Norfolk County with nearby schools including Eliot Elementary School, High Rock Middle School, and Pollard Middle School.
Ownership History
Date
Name
Owned For
Owner Type
Purchase Details
Closed on
Jan 10, 2007
Sold by
Gorelchenka Diane A and Profis Eleanor
Bought by
Tsitsas George and Tsitsas Lambrini K
Current Estimated Value
Home Financials for this Owner
Home Financials are based on the most recent Mortgage that was taken out on this home.
Original Mortgage
$300,800
Outstanding Balance
$179,457
Interest Rate
6.18%
Mortgage Type
Purchase Money Mortgage
Estimated Equity
$1,670,887
Create a Home Valuation Report for This Property
The Home Valuation Report is an in-depth analysis detailing your home's value as well as a comparison with similar homes in the area
Home Values in the Area
Average Home Value in this Area
Purchase History
| Date | Buyer | Sale Price | Title Company |
|---|---|---|---|
| Tsitsas George | $376,000 | -- | |
| Tsitsas George | $376,000 | -- |
Source: Public Records
Mortgage History
| Date | Status | Borrower | Loan Amount |
|---|---|---|---|
| Open | Tsitsas George | $300,800 | |
| Closed | Tsitsas George | $75,200 | |
| Closed | Tsitsas George | $300,800 |
Source: Public Records
Tax History
| Year | Tax Paid | Tax Assessment Tax Assessment Total Assessment is a certain percentage of the fair market value that is determined by local assessors to be the total taxable value of land and additions on the property. | Land | Improvement |
|---|---|---|---|---|
| 2025 | $16,004 | $1,509,800 | $661,100 | $848,700 |
| 2024 | $14,766 | $1,179,400 | $555,000 | $624,400 |
| 2023 | $14,661 | $1,124,300 | $555,000 | $569,300 |
| 2022 | $13,873 | $1,037,600 | $487,200 | $550,400 |
| 2021 | $13,520 | $1,037,600 | $487,200 | $550,400 |
| 2020 | $12,861 | $1,029,700 | $487,200 | $542,500 |
| 2019 | $12,096 | $976,300 | $443,200 | $533,100 |
| 2018 | $11,598 | $976,300 | $443,200 | $533,100 |
| 2017 | $10,747 | $903,900 | $443,200 | $460,700 |
| 2016 | $10,431 | $903,900 | $443,200 | $460,700 |
| 2015 | $10,205 | $903,900 | $443,200 | $460,700 |
| 2014 | $9,941 | $854,000 | $403,200 | $450,800 |
Source: Public Records
Map
Nearby Homes
- 40 High St
- 400 Hunnewell St Unit 103
- 132 Hillside Ave
- 140 Hillside Ave
- 140 Hillside Ave Unit a
- 379 Hunnewell St Unit 379
- 3 Crescent Rd
- 108 Woodbine Cir
- 445 Hillside Ave
- 5 Hazel Ln
- 100 Rosemary Way Unit 129
- 62 Evelyn Rd
- 143 Hunting Rd
- 34 Pershing Rd
- 12 Hill St
- 638 Webster St
- 638 Webster St Unit 638
- 74 Gary Rd
- 443 Central Ave
- 168 Richdale Rd
- 357 Webster St
- 361 Webster St
- 11 Mark Lee Rd
- 362 Webster St
- 354 Webster St
- 58-60 Webster St
- 49 Alfreton Rd
- 17 Mark Lee Rd
- 59 Park Ave
- 348 Webster St
- 6 Mark Lee Rd
- 43 Alfreton Rd
- 55 Alfreton Rd
- 372 Webster St
- 28 Mercer Rd
- 12 Mark Lee Rd
- Lot B Webster St
- 51 Park Ave
- 18 Mark Lee Rd
- 18 Mark Lee Rd Unit 1st floor