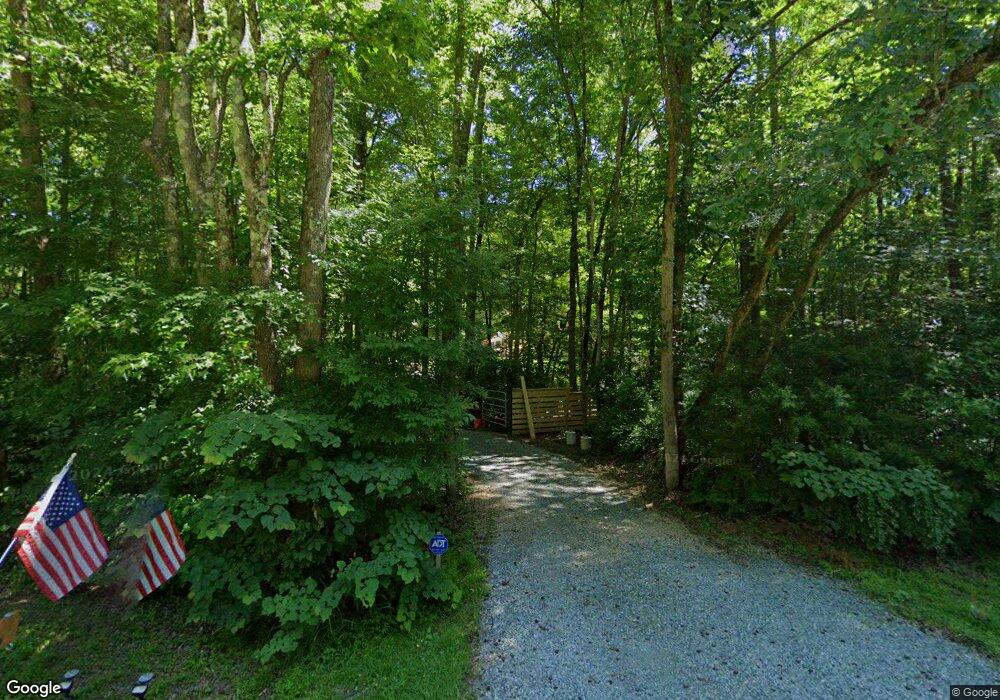
3550 Hamlets Chapel Rd Pittsboro, NC 27312
Estimated Value: $399,000 - $485,000
2
Beds
1
Bath
1,140
Sq Ft
$380/Sq Ft
Est. Value
About This Home
This home is located at 3550 Hamlets Chapel Rd, Pittsboro, NC 27312 and is currently estimated at $433,004, approximately $379 per square foot. 3550 Hamlets Chapel Rd is a home located in Chatham County with nearby schools including Perry W. Harrison Elementary School, Margaret B. Pollard Middle School, and Northwood High.
Ownership History
Date
Name
Owned For
Owner Type
Purchase Details
Closed on
Apr 21, 2020
Sold by
Wade Luke and Wade Laurie
Bought by
Possien Kevin R and Possien Kristy L
Current Estimated Value
Home Financials for this Owner
Home Financials are based on the most recent Mortgage that was taken out on this home.
Original Mortgage
$251,750
Outstanding Balance
$222,106
Interest Rate
3.3%
Mortgage Type
New Conventional
Estimated Equity
$210,898
Purchase Details
Closed on
Jun 22, 2017
Sold by
Taylor Ashton Ross
Bought by
Wade Luke and Wade Laurie
Home Financials for this Owner
Home Financials are based on the most recent Mortgage that was taken out on this home.
Original Mortgage
$158,000
Interest Rate
4.05%
Mortgage Type
New Conventional
Purchase Details
Closed on
Aug 3, 2015
Sold by
Samana Deborah Zen
Bought by
Taylor Ashton Ross
Create a Home Valuation Report for This Property
The Home Valuation Report is an in-depth analysis detailing your home's value as well as a comparison with similar homes in the area
Home Values in the Area
Average Home Value in this Area
Purchase History
| Date | Buyer | Sale Price | Title Company |
|---|---|---|---|
| Possien Kevin R | $265,000 | None Available | |
| Wade Luke | $228,000 | None Available | |
| Taylor Ashton Ross | $210,000 | Attorney |
Source: Public Records
Mortgage History
| Date | Status | Borrower | Loan Amount |
|---|---|---|---|
| Open | Possien Kevin R | $251,750 | |
| Previous Owner | Wade Luke | $158,000 |
Source: Public Records
Tax History Compared to Growth
Tax History
| Year | Tax Paid | Tax Assessment Tax Assessment Total Assessment is a certain percentage of the fair market value that is determined by local assessors to be the total taxable value of land and additions on the property. | Land | Improvement |
|---|---|---|---|---|
| 2025 | $2,818 | $379,075 | $148,444 | $230,631 |
| 2024 | $2,818 | $281,178 | $134,325 | $146,853 |
| 2023 | $2,535 | $281,178 | $134,325 | $146,853 |
| 2022 | $2,327 | $281,178 | $134,325 | $146,853 |
| 2021 | $2,299 | $281,178 | $134,325 | $146,853 |
| 2020 | $1,761 | $210,234 | $69,588 | $140,646 |
| 2019 | $1,761 | $210,234 | $69,588 | $140,646 |
| 2018 | $1,662 | $210,234 | $69,588 | $140,646 |
| 2017 | $1,661 | $212,008 | $71,362 | $140,646 |
| 2016 | $1,399 | $172,957 | $64,875 | $108,082 |
| 2015 | $382 | $172,957 | $64,875 | $108,082 |
| 2014 | -- | $172,957 | $64,875 | $108,082 |
| 2013 | -- | $172,957 | $64,875 | $108,082 |
Source: Public Records
Map
Nearby Homes
- 0 Bygone Way
- 4025 Hamlets Chapel Rd
- 50 Harrison Pond Dr
- 196 Paces Mill Trail
- 0 Hamlets Chapel Rd Unit 10024186
- 00 Hamlets Chapel Rd
- 67 Ada Ct
- 58 Mint Springs Rd
- 114 Margaret Mann Way
- 480 Lila Dr
- 236 Emelia Ln
- 33 Versailles Ln
- 2430 Jones Ferry Rd
- 0 Jones Ferry Rd Unit 10129534
- 441 Lila Dr
- 205 Riverine Dr
- 346 Lila Dr
- 405 Lila Dr
- 339 Lila Dr
- 85 Noble Reserve Way
- 3550 Hamlets Chapel Rd
- 700 Oak Hill Rd
- 3618 Hamlets Chapel Rd
- 106 Dorcutt Hills Rd
- 674 Oak Hill Rd
- 50 Dorcutt Hills Rd
- 3587 Hamlet Chapel Rd
- 685 Oak Hill Rd
- 604 Oak Hill Rd
- 15 Pine Terrace Rd
- 0 Hamlet Chapel Rd Unit 1867507
- 0 Hamlet Chapel Rd Unit 23
- 312 Dorcutt Hills Rd
- 603 Oak Hill Rd
- 3389 Hamlet Chapel Rd
- 3389 Hamlets Chapel Rd
- 153 Dorcutt Hills Rd
- 546 Oak Hill Rd
- 179 Dorcutt Hills Rd
- 3358 Hamlet Chapel Rd