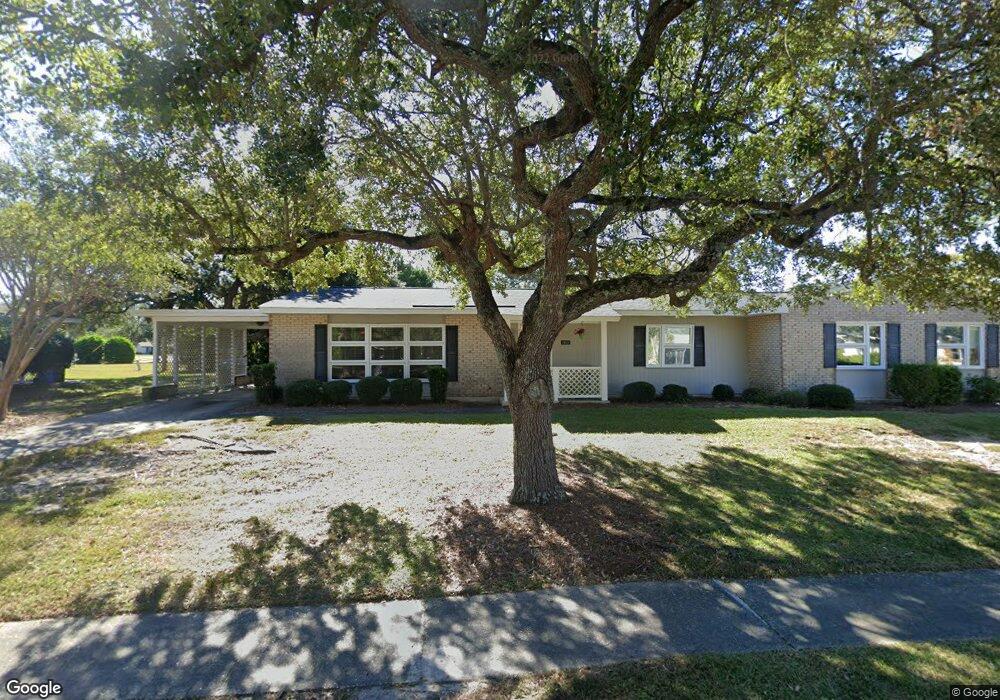
3551 Ash St Unit F Myrtle Beach, SC 29577
Seagate Village NeighborhoodEstimated Value: $216,000 - $283,000
2
Beds
1
Bath
1,186
Sq Ft
$206/Sq Ft
Est. Value
About This Home
This home is located at 3551 Ash St Unit F, Myrtle Beach, SC 29577 and is currently estimated at $243,904, approximately $205 per square foot. 3551 Ash St Unit F is a home located in Horry County with nearby schools including Myrtle Beach Child Development Center, Myrtle Beach Primary School, and Myrtle Beach Elementary School.
Ownership History
Date
Name
Owned For
Owner Type
Purchase Details
Closed on
Sep 23, 2019
Sold by
Graham Shirley A
Bought by
Brabson Mark and Thia
Current Estimated Value
Home Financials for this Owner
Home Financials are based on the most recent Mortgage that was taken out on this home.
Original Mortgage
$160,886
Outstanding Balance
$140,633
Interest Rate
3.5%
Mortgage Type
VA
Estimated Equity
$103,271
Purchase Details
Closed on
Sep 28, 2010
Sold by
Hatchell Ryan Lawrence
Bought by
Graham Shirley A
Purchase Details
Closed on
Sep 9, 2005
Sold by
Hatchell Ryan Lawrence and Hatchell Samantha Michelle
Bought by
Hatchell Ryan Lawrence and Hatchell Samantha Michelle
Purchase Details
Closed on
Jul 2, 2003
Sold by
Seagate Village Development Llc
Bought by
Hatchell Ryan Lawrence and Holliday Samantha Michelle
Create a Home Valuation Report for This Property
The Home Valuation Report is an in-depth analysis detailing your home's value as well as a comparison with similar homes in the area
Home Values in the Area
Average Home Value in this Area
Purchase History
| Date | Buyer | Sale Price | Title Company |
|---|---|---|---|
| Brabson Mark | $157,500 | -- | |
| Graham Shirley A | $80,010 | -- | |
| Hatchell Ryan Lawrence | -- | -- | |
| Hatchell Ryan Lawrence | $79,850 | -- |
Source: Public Records
Mortgage History
| Date | Status | Borrower | Loan Amount |
|---|---|---|---|
| Open | Brabson Mark | $160,886 |
Source: Public Records
Tax History Compared to Growth
Tax History
| Year | Tax Paid | Tax Assessment Tax Assessment Total Assessment is a certain percentage of the fair market value that is determined by local assessors to be the total taxable value of land and additions on the property. | Land | Improvement |
|---|---|---|---|---|
| 2024 | $2,717 | $13,500 | $0 | $13,500 |
| 2023 | $2,717 | $16,244 | $0 | $16,244 |
| 2021 | $2,507 | $16,244 | $0 | $16,244 |
| 2020 | $2,391 | $16,244 | $0 | $16,244 |
| 2019 | $1,672 | $13,125 | $0 | $13,125 |
| 2018 | $0 | $9,870 | $0 | $9,870 |
| 2017 | $1,483 | $5,640 | $0 | $5,640 |
| 2016 | -- | $5,640 | $0 | $5,640 |
| 2015 | $1,466 | $9,870 | $0 | $9,870 |
| 2014 | $1,426 | $5,640 | $0 | $5,640 |
Source: Public Records
Map
Nearby Homes
- 3545 Elderberry St Unit 3545
- 3523 Chestnut Dr
- 645 Hemlock Ave Unit 645
- 3530 Evergreen Way
- 3526 Evergreen Way Unit 3526
- 1652 Perry Cir
- 3645 Cypress Cir Unit 3645
- 1616 Perry Cir
- 1715 Club House Dr
- 628 Quince Ave Unit 628
- 3452 Baldwin Ln
- 3448 Baldwin Ln
- 780 Gabreski Ln Unit A-2
- 1651 Perry Cir
- 763 Moen Place Unit 763-B
- 750 Howard Ave Unit E
- 539 Redwood Ave Unit 539
- 3385 Pampas Dr
- 754 Murray Ave
- 830 Howard Ave Unit D
- 3551 Ash St Unit 3551
- 3555 Ash St Unit 3555 Seagate Village
- 3555 Ash St
- 3547 Ash St Unit 3547
- 3559 Ash St Unit 3559
- 3552 Ash St Unit 3552
- 3540 Willow St Unit Seagate Village
- 3540 Willow St Unit 3540
- 3548 Ash St Unit 3548
- 3548 Willow St Unit 3548
- 659 Cardinal Ave Unit 659
- 663 Cardinal Ave Unit 663
- 3556 Ash St Unit 3556
- 3560 Ash St Unit 3560
- 3552 Willow St Unit 3552
- 3535 Cactus St Unit 3535
- 3540 Ash St Unit 3540
- 3531 Cactus St Unit 3531
- 3541 Willow St Unit 3541
- 3539 Cactus St Unit 3539 Seagate Village