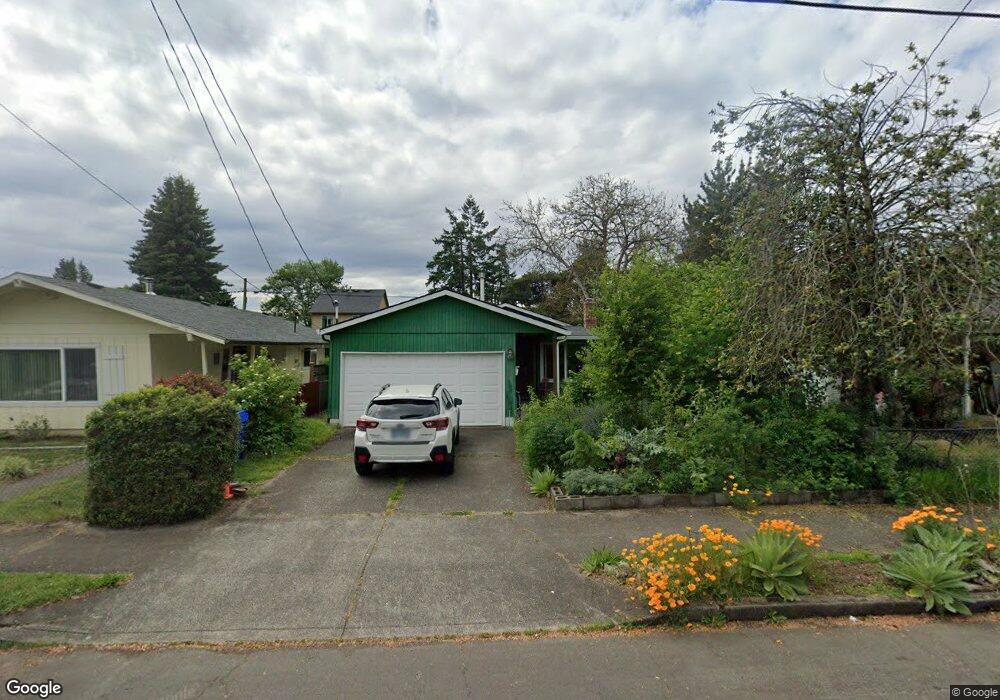
3553 SE 68th Ave Portland, OR 97206
Foster-Powell NeighborhoodEstimated Value: $409,000 - $454,000
3
Beds
2
Baths
1,000
Sq Ft
$435/Sq Ft
Est. Value
About This Home
This home is located at 3553 SE 68th Ave, Portland, OR 97206 and is currently estimated at $435,067, approximately $435 per square foot. 3553 SE 68th Ave is a home located in Multnomah County with nearby schools including Arleta Elementary School, Franklin High School, and St Ignatius School.
Ownership History
Date
Name
Owned For
Owner Type
Purchase Details
Closed on
Aug 9, 2023
Sold by
Green Rentals Llc
Bought by
Ozenne Eric and Ozenne Vesta Lara
Current Estimated Value
Home Financials for this Owner
Home Financials are based on the most recent Mortgage that was taken out on this home.
Original Mortgage
$350,000
Outstanding Balance
$336,875
Interest Rate
4%
Mortgage Type
VA
Estimated Equity
$98,192
Purchase Details
Closed on
Aug 18, 2015
Sold by
Green Eve R
Bought by
Green Rentals Llc
Purchase Details
Closed on
Aug 24, 2011
Sold by
Federal Home Loan Mortgage Corporation
Bought by
Green Eve
Purchase Details
Closed on
Jan 7, 2011
Sold by
Bernett Ronald D
Bought by
Federal Home Loan Mortgage Corp
Purchase Details
Closed on
Aug 16, 1995
Sold by
Ngoan Hua
Bought by
Bernett Ronald D
Home Financials for this Owner
Home Financials are based on the most recent Mortgage that was taken out on this home.
Original Mortgage
$79,764
Interest Rate
7.71%
Mortgage Type
Purchase Money Mortgage
Create a Home Valuation Report for This Property
The Home Valuation Report is an in-depth analysis detailing your home's value as well as a comparison with similar homes in the area
Home Values in the Area
Average Home Value in this Area
Purchase History
| Date | Buyer | Sale Price | Title Company |
|---|---|---|---|
| Ozenne Eric | $350,000 | Chicago Title | |
| Green Rentals Llc | -- | None Available | |
| Green Eve | $135,811 | Stewart Title | |
| Federal Home Loan Mortgage Corp | $174,010 | Fatco | |
| Bernett Ronald D | $92,000 | -- |
Source: Public Records
Mortgage History
| Date | Status | Borrower | Loan Amount |
|---|---|---|---|
| Open | Ozenne Eric | $350,000 | |
| Previous Owner | Bernett Ronald D | $79,764 |
Source: Public Records
Tax History Compared to Growth
Tax History
| Year | Tax Paid | Tax Assessment Tax Assessment Total Assessment is a certain percentage of the fair market value that is determined by local assessors to be the total taxable value of land and additions on the property. | Land | Improvement |
|---|---|---|---|---|
| 2024 | $5,367 | $169,950 | -- | -- |
| 2023 | $5,161 | $194,760 | $0 | $0 |
| 2022 | $5,049 | $189,090 | $0 | $0 |
| 2021 | $4,964 | $183,590 | $0 | $0 |
| 2020 | $4,554 | $178,250 | $0 | $0 |
| 2019 | $4,522 | $173,060 | $0 | $0 |
| 2018 | $4,257 | $168,020 | $0 | $0 |
| 2017 | $4,080 | $163,130 | $0 | $0 |
| 2016 | $3,734 | $158,380 | $0 | $0 |
| 2015 | $3,636 | $153,770 | $0 | $0 |
| 2014 | $3,328 | $149,300 | $0 | $0 |
Source: Public Records
Map
Nearby Homes
- 3633 SE 68th Ave
- 3903 SE 66th Ave
- 3405 SE 69th Ave
- 6721 SE Gladstone St
- 6723 SE Gladstone St
- 6719 SE Gladstone St
- 6731 SE Gladstone St
- 3801 SE 72nd Ave
- 3535 SE 73rd Ave
- 7027 SE Boise St
- 7215 SE Powell Blvd
- 6037 SE Francis St
- 2931 SE 67th Ave
- 3182 SE 62nd Ave
- 4324 SE 64th Ave
- 4404 SE 64th Ave
- 4417 SE 65th Ave
- 4318 SE 72nd Ave
- 4314 SE 72nd Ave Unit 4318
- 3034 SE 73rd Ave
- 3603 SE 68th Ave
- 3549 SE 68th Ave
- 3609 SE 68th Ave
- 3543 SE 68th Ave
- 3558 SE 67th Ave
- 3550 SE 67th Ave
- 3615 SE 68th Ave
- 3539 SE 68th Ave
- 3606 SE 67th Ave
- 3548 SE 67th Ave
- 3610 SE 67th Ave
- 3538 SE 67th Ave
- 3538 SE 67th Ave Unit B
- 3538 SE 67th Ave Unit A
- 3550 SE 68th Ave
- 3604 SE 68th Ave
- 3621 SE 68th Ave
- 3535 SE 68th Ave
- 3542 SE 68th Ave
- 3540 SE 67th Ave