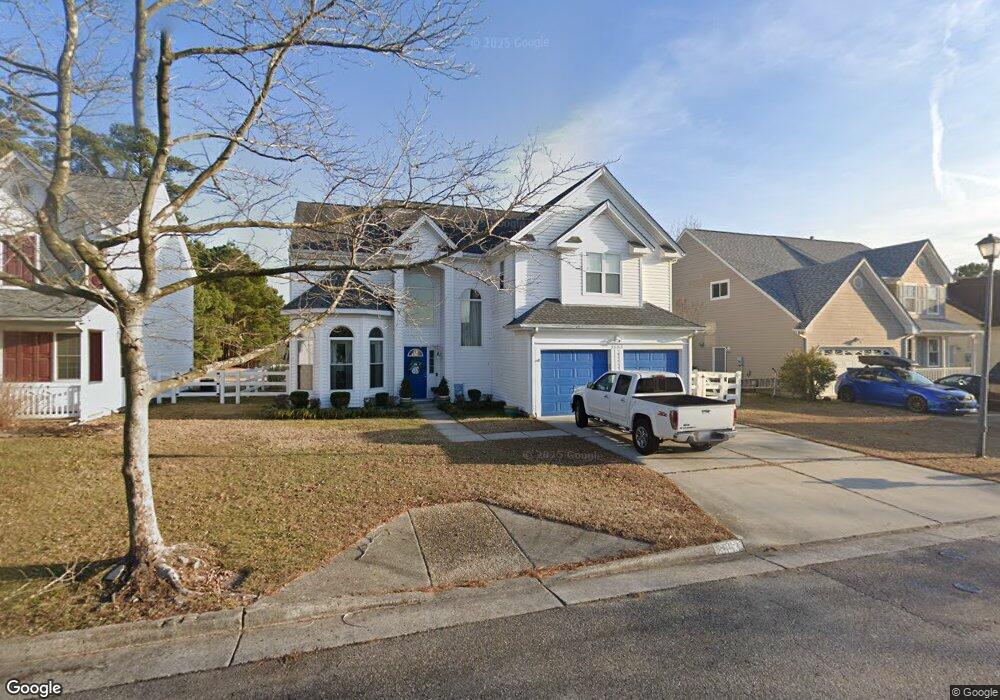
3553 Storm Bird Loop Virginia Beach, VA 23453
Green Run NeighborhoodEstimated Value: $533,581 - $552,000
4
Beds
3
Baths
2,483
Sq Ft
$220/Sq Ft
Est. Value
About This Home
This home is located at 3553 Storm Bird Loop, Virginia Beach, VA 23453 and is currently estimated at $545,395, approximately $219 per square foot. 3553 Storm Bird Loop is a home located in Virginia Beach City with nearby schools including Landstown Elementary School, Landstown Middle School, and Landstown High School.
Ownership History
Date
Name
Owned For
Owner Type
Purchase Details
Closed on
Jan 16, 2024
Sold by
Babcock Lynda
Bought by
Lynda J Babcock Irrevocable Trust and Babcock
Current Estimated Value
Purchase Details
Closed on
May 31, 2018
Sold by
Rensing Barry J and Rensing Mildred R
Bought by
Babcock Walter and Babcock Lynda
Purchase Details
Closed on
May 15, 2010
Sold by
Anger Gregory P
Bought by
Rensing Barry J
Home Financials for this Owner
Home Financials are based on the most recent Mortgage that was taken out on this home.
Original Mortgage
$315,065
Interest Rate
5.23%
Mortgage Type
VA
Purchase Details
Closed on
Jun 21, 2005
Sold by
Collins John
Bought by
Anger Gregory
Home Financials for this Owner
Home Financials are based on the most recent Mortgage that was taken out on this home.
Original Mortgage
$110,000
Interest Rate
5.82%
Mortgage Type
New Conventional
Create a Home Valuation Report for This Property
The Home Valuation Report is an in-depth analysis detailing your home's value as well as a comparison with similar homes in the area
Home Values in the Area
Average Home Value in this Area
Purchase History
| Date | Buyer | Sale Price | Title Company |
|---|---|---|---|
| Lynda J Babcock Irrevocable Trust | -- | None Listed On Document | |
| Babcock Walter | $339,000 | Advance Title & Abstract Inc | |
| Rensing Barry J | $305,000 | -- | |
| Anger Gregory | $350,500 | -- |
Source: Public Records
Mortgage History
| Date | Status | Borrower | Loan Amount |
|---|---|---|---|
| Previous Owner | Rensing Barry J | $315,065 | |
| Previous Owner | Anger Gregory | $110,000 |
Source: Public Records
Tax History Compared to Growth
Tax History
| Year | Tax Paid | Tax Assessment Tax Assessment Total Assessment is a certain percentage of the fair market value that is determined by local assessors to be the total taxable value of land and additions on the property. | Land | Improvement |
|---|---|---|---|---|
| 2025 | $4,392 | $462,100 | $170,000 | $292,100 |
| 2024 | $4,392 | $452,800 | $170,000 | $282,800 |
| 2023 | $4,527 | $457,300 | $165,600 | $291,700 |
| 2022 | $4,038 | $407,900 | $138,000 | $269,900 |
| 2021 | $3,578 | $361,400 | $124,000 | $237,400 |
| 2020 | $3,474 | $341,400 | $116,000 | $225,400 |
| 2019 | $3,387 | $329,300 | $116,000 | $213,300 |
| 2018 | $3,301 | $329,300 | $116,000 | $213,300 |
| 2017 | $3,179 | $317,100 | $112,000 | $205,100 |
| 2016 | $3,047 | $307,800 | $109,000 | $198,800 |
| 2015 | $2,966 | $299,600 | $105,000 | $194,600 |
| 2014 | $2,630 | $299,900 | $110,900 | $189,000 |
Source: Public Records
Map
Nearby Homes
- 3684 Purebred Dr
- 1709 Purpose Dr
- 3416 Crimson Holly Ct
- 3452 Poppy Crescent
- 3449 Petunia Crescent
- 3429 Plum Crescent
- 3309 Weeping Willow Ln
- 1076 Old Clubhouse Rd
- 1392 Sierra Dr
- 3519 Argo Ct
- 3554 Brigita Ct
- 3537 Plum Crescent
- 3425 Landstown Ct
- 1804 Monet Ct
- 1308 Swallow Dr
- 3248 Yorkborough Way
- 1140 Old Clubhouse Rd
- 3143 Glastonbury Dr
- 3004 Glastonbury Cir
- 3152 Monet Dr
- 3549 Storm Bird Loop
- 3557 Storm Bird Loop
- 3545 Storm Bird Loop
- 3561 Storm Bird Loop
- 1512 Pony Ct
- 3541 Storm Bird Loop
- 1513 Pony Ct
- 3565 Storm Bird Loop
- 1508 Pony Ct
- 3736 Storm Bird Loop
- 3537 Storm Bird Loop
- 3568 Storm Bird Loop
- 3569 Storm Bird Loop
- 1504 Pony Ct
- 3533 Storm Bird Loop
- 1505 Pony Ct
- 3576 Storm Bird Loop
- 3573 Storm Bird Loop
- 3728 Storm Bird Loop
- 1500 Pony Ct