3553 Sylvan Pines Cir Unit 32 Bremerton, WA 98310
Estimated Value: $334,000 - $393,000
3
Beds
2
Baths
1,480
Sq Ft
$249/Sq Ft
Est. Value
About This Home
This home is located at 3553 Sylvan Pines Cir Unit 32, Bremerton, WA 98310 and is currently estimated at $367,886, approximately $248 per square foot. 3553 Sylvan Pines Cir Unit 32 is a home located in Kitsap County with nearby schools including Armin Jahr Elementary School, Mountain View Middle School, and Bremerton High School.
Ownership History
Date
Name
Owned For
Owner Type
Purchase Details
Closed on
Oct 9, 2018
Sold by
Olson I Su
Bought by
Alexander Lorene
Current Estimated Value
Purchase Details
Closed on
Oct 5, 2018
Sold by
Olson I Su
Bought by
Alexander Lorene
Purchase Details
Closed on
Jul 14, 2014
Sold by
Judd Ralph
Bought by
Olson I Su and Olson John W
Home Financials for this Owner
Home Financials are based on the most recent Mortgage that was taken out on this home.
Original Mortgage
$100,000
Interest Rate
4.1%
Mortgage Type
New Conventional
Purchase Details
Closed on
Apr 1, 2009
Sold by
Williams Judith M and Grose Ronald
Bought by
Judd Ralph and Judd Sarah
Purchase Details
Closed on
Mar 25, 1999
Sold by
Housing Authority Of City Of Bremerton
Bought by
Grose Martha I
Home Financials for this Owner
Home Financials are based on the most recent Mortgage that was taken out on this home.
Original Mortgage
$45,000
Interest Rate
6.73%
Create a Home Valuation Report for This Property
The Home Valuation Report is an in-depth analysis detailing your home's value as well as a comparison with similar homes in the area
Home Values in the Area
Average Home Value in this Area
Purchase History
| Date | Buyer | Sale Price | Title Company |
|---|---|---|---|
| Alexander Lorene | $120,000 | Land Title | |
| Alexander Lorene | $120,000 | Land Title | |
| Olson I Su | $155,280 | Pacific Northwest Title | |
| Judd Ralph | $188,280 | Pacific Nw Title | |
| Grose Martha I | -- | Transnation Title Insurance |
Source: Public Records
Mortgage History
| Date | Status | Borrower | Loan Amount |
|---|---|---|---|
| Previous Owner | Olson I Su | $100,000 | |
| Previous Owner | Grose Martha I | $45,000 |
Source: Public Records
Tax History Compared to Growth
Tax History
| Year | Tax Paid | Tax Assessment Tax Assessment Total Assessment is a certain percentage of the fair market value that is determined by local assessors to be the total taxable value of land and additions on the property. | Land | Improvement |
|---|---|---|---|---|
| 2026 | $2,542 | $293,750 | $91,040 | $202,710 |
| 2025 | $2,542 | $293,750 | $91,040 | $202,710 |
| 2024 | $2,452 | $293,750 | $91,040 | $202,710 |
| 2023 | $2,535 | $293,750 | $91,040 | $202,710 |
| 2022 | $2,349 | $244,980 | $75,870 | $169,110 |
| 2021 | $2,078 | $198,410 | $48,230 | $150,180 |
| 2020 | $1,940 | $185,380 | $44,970 | $140,410 |
| 2019 | $1,682 | $166,940 | $40,410 | $126,530 |
| 2018 | $2,060 | $158,200 | $34,300 | $123,900 |
| 2017 | $2,023 | $158,200 | $34,300 | $123,900 |
| 2016 | $1,877 | $139,050 | $30,090 | $108,960 |
| 2015 | $1,284 | $94,630 | $30,470 | $64,160 |
| 2014 | -- | $91,160 | $30,470 | $60,690 |
| 2013 | -- | $97,350 | $32,610 | $64,740 |
Source: Public Records
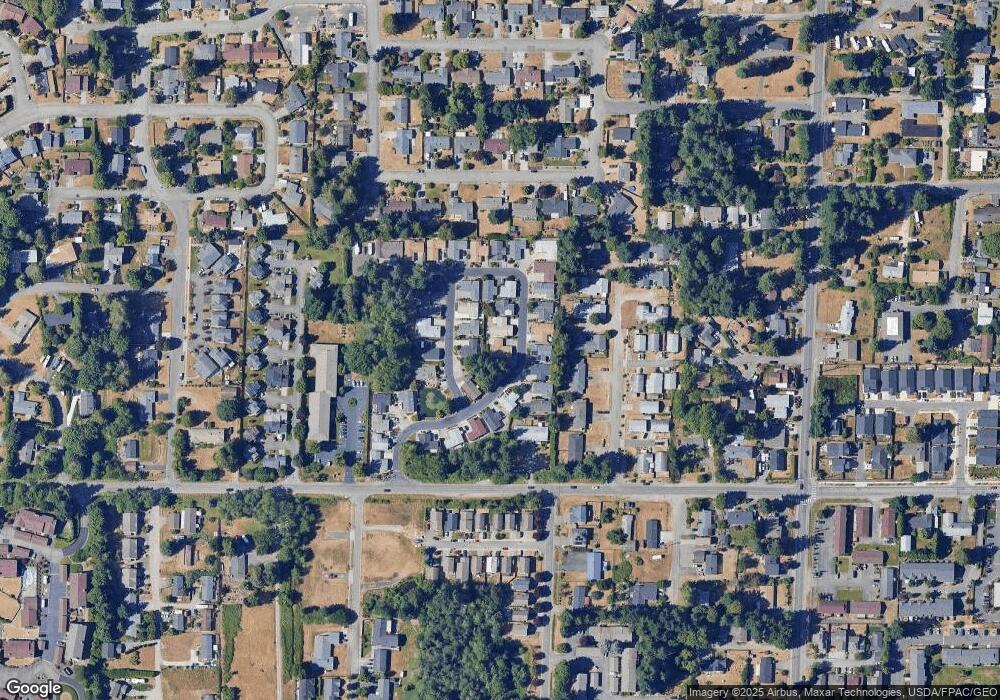
Map
Nearby Homes
- 223 Alnus Way
- 3400 Narrows View Ln NE Unit 204
- 3868 Pinecone Dr NE
- 3560 Narrows View Ln NE Unit 5-201
- 3560 Narrows View Ln NE Unit 202
- 3835 Earendale Ave
- 3340 Narrows View Ln NE Unit 103
- 3340 Narrows View Ln NE Unit 203
- 414 E 31st St
- 638 Shirehill St
- 654 E 31st St
- 3023 Pawnee Dr
- 3347 Amak Ln
- 802 Hanford Ave
- 4 Sulphur Springs Ln
- 937 Pearl St
- 3585 Sulphur Springs Ln
- 3573 Sulphur Springs Ln
- 0 XXX Tracyton Beach Rd NW
- 0 Tracyton Beach Rd NW
- 3557 Sylvan Pines Cir
- 3554 Sylvan Pines Ln Unit 40
- 3559 Sylvan Pines Cir
- 3558 Sylvan Pines Ln Unit 39
- 3561 Sylvan Pines Cir
- 3548 Sylvan Pines Cir
- 3556 Sylvan Pines Cir Unit 15
- 3538 Sylvan Pines Ln Unit 31
- 3560 Sylvan Pines Cir
- 3544 Sylvan Pines Cir
- 3580 Sylvan Pines Cir
- 3565 Sylvan Pines Cir
- 3566 Sylvan Pines Ln Unit 37
- 3540 Sylvan Pines Cir Unit 11
- 3532 Sylvan Pines Cir Unit 9
- 3551 Sylvan Pines Ln Unit 30
- 3564 Sylvan Pines Cir
- 3555 Sylvan Pines Ln
- 3559 Sylvan Pines Ln Unit 28
- 3528 Sylvan Pines Cir Unit 8