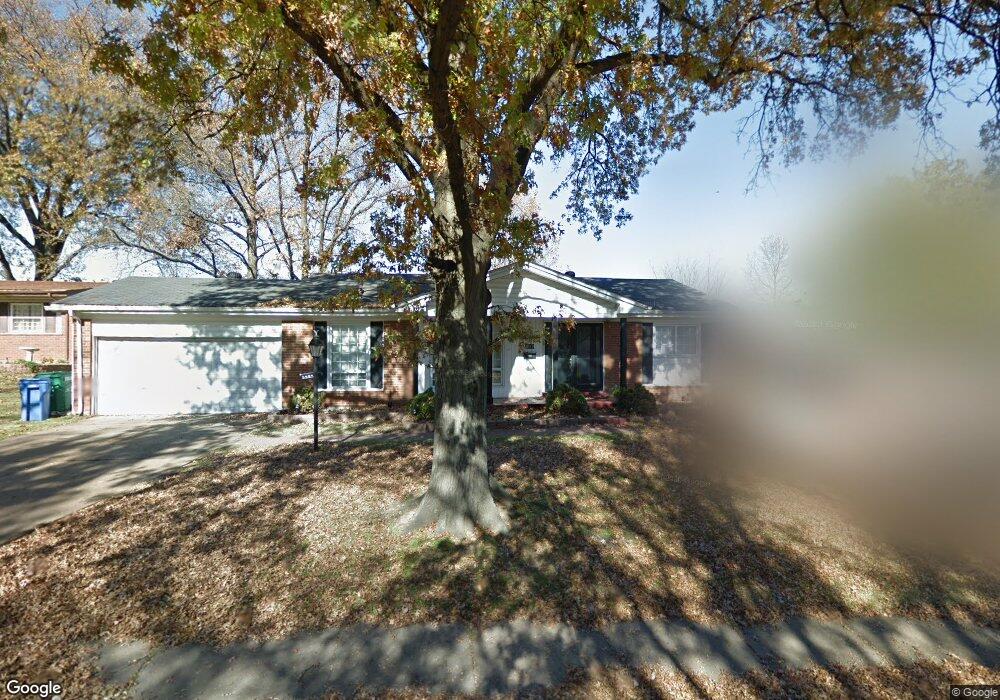
3555 Dwyer Ln Florissant, MO 63033
Estimated Value: $200,000 - $230,000
4
Beds
2
Baths
1,616
Sq Ft
$133/Sq Ft
Est. Value
About This Home
This home is located at 3555 Dwyer Ln, Florissant, MO 63033 and is currently estimated at $215,014, approximately $133 per square foot. 3555 Dwyer Ln is a home located in St. Louis County with nearby schools including Halls Ferry Elementary School, Cross Keys Middle School, and McCluer North High School.
Ownership History
Date
Name
Owned For
Owner Type
Purchase Details
Closed on
Nov 24, 2004
Sold by
Enste Eric F
Bought by
Porter Margaret
Current Estimated Value
Home Financials for this Owner
Home Financials are based on the most recent Mortgage that was taken out on this home.
Original Mortgage
$147,500
Outstanding Balance
$73,116
Interest Rate
5.68%
Mortgage Type
Purchase Money Mortgage
Estimated Equity
$141,898
Purchase Details
Closed on
Mar 10, 2004
Sold by
Deshazier Jerry L
Bought by
Enste Eric F
Home Financials for this Owner
Home Financials are based on the most recent Mortgage that was taken out on this home.
Original Mortgage
$86,000
Interest Rate
3.75%
Mortgage Type
Purchase Money Mortgage
Purchase Details
Closed on
Nov 25, 1997
Sold by
Willig Robert A and Willig Corrine D
Bought by
Deshazier Jerry L
Home Financials for this Owner
Home Financials are based on the most recent Mortgage that was taken out on this home.
Original Mortgage
$87,600
Interest Rate
7.31%
Mortgage Type
VA
Create a Home Valuation Report for This Property
The Home Valuation Report is an in-depth analysis detailing your home's value as well as a comparison with similar homes in the area
Home Values in the Area
Average Home Value in this Area
Purchase History
| Date | Buyer | Sale Price | Title Company |
|---|---|---|---|
| Porter Margaret | $147,500 | Ort | |
| Enste Eric F | $90,562 | -- | |
| Deshazier Jerry L | -- | -- |
Source: Public Records
Mortgage History
| Date | Status | Borrower | Loan Amount |
|---|---|---|---|
| Open | Porter Margaret | $147,500 | |
| Previous Owner | Enste Eric F | $86,000 | |
| Previous Owner | Deshazier Jerry L | $87,600 |
Source: Public Records
Tax History Compared to Growth
Tax History
| Year | Tax Paid | Tax Assessment Tax Assessment Total Assessment is a certain percentage of the fair market value that is determined by local assessors to be the total taxable value of land and additions on the property. | Land | Improvement |
|---|---|---|---|---|
| 2025 | $2,901 | $38,110 | $5,450 | $32,660 |
| 2024 | $2,901 | $35,890 | $4,730 | $31,160 |
| 2023 | $2,884 | $35,890 | $4,730 | $31,160 |
| 2022 | $2,348 | $25,580 | $3,650 | $21,930 |
| 2021 | $2,207 | $25,580 | $3,650 | $21,930 |
| 2020 | $1,993 | $21,700 | $4,730 | $16,970 |
| 2019 | $1,952 | $21,700 | $4,730 | $16,970 |
| 2018 | $1,944 | $19,420 | $3,270 | $16,150 |
| 2017 | $1,934 | $19,420 | $3,270 | $16,150 |
| 2016 | $1,904 | $18,580 | $3,650 | $14,930 |
| 2015 | $1,913 | $18,580 | $3,650 | $14,930 |
| 2014 | $2,173 | $21,050 | $4,730 | $16,320 |
Source: Public Records
Map
Nearby Homes
- 2010 Cordoba Dr
- 3680 Pyrenees Dr
- 1805 Aqueduct Dr
- 1670 Aqueduct Dr
- 3420 Rockingham Dr
- 2130 Barcelona Dr
- 2065 Carefree Ln Unit G
- 3181 Carefree Ln Unit A
- 3870 Woodcrest Dr
- 3722 Candlewyck Club Dr Unit D
- 1540 Ascot Terrace
- 1590 Bay Meadows Dr
- 3614 Candlewyck Club Dr Unit E
- 3707 Candlewyck Club Dr Unit C
- 3190 N Waterford Dr
- 3524 Candlebrook Ct
- 3150 Parker Rd
- 3230 Churchill Dr
- Lot 6 Wildridge Estates
- 3 Wild Ridge Estates Turnberry Ct
- 3545 Dwyer Ln
- 3565 Dwyer Ln
- 3560 Santiago Dr
- 3540 Santiago Dr
- 3535 Dwyer Ln
- 3570 Santiago Dr
- 3575 Dwyer Ln
- 3530 Santiago Dr
- 3560 Dwyer Ln
- 3550 Dwyer Ln
- 3570 Dwyer Ln
- 3580 Santiago Dr
- 3505 Dwyer Ln
- 3585 Dwyer Ln
- 3520 Santiago Dr
- 3530 Dwyer Ln
- 3580 Dwyer Ln
- 3510 Dwyer Ln
- 3590 Santiago Dr
- 3495 Dwyer Ln