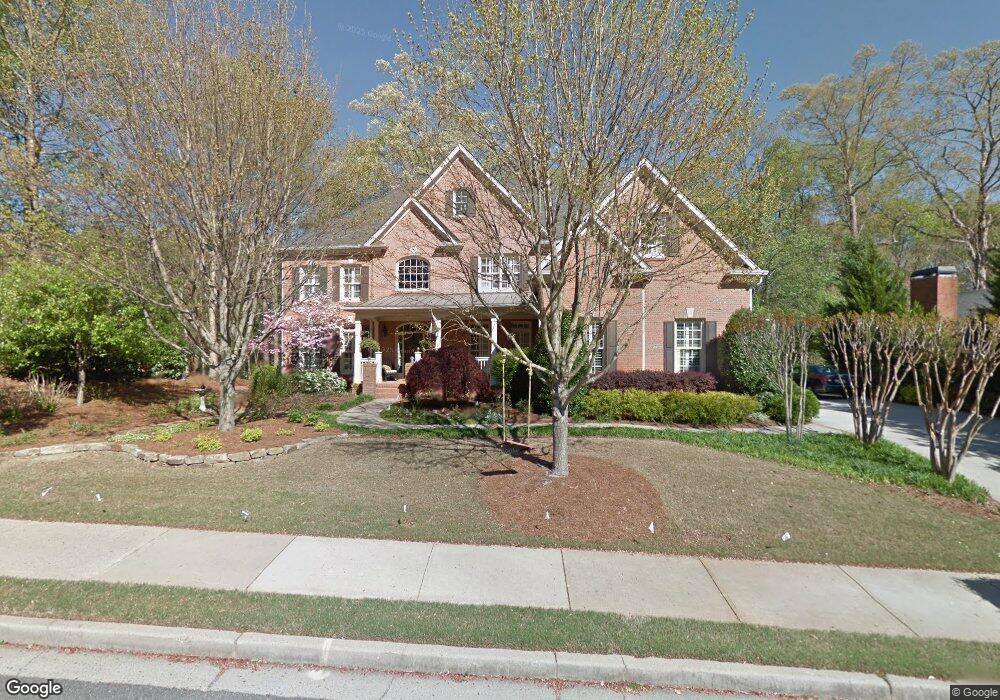
3555 Grey Abbey Dr Unit II Alpharetta, GA 30022
Estimated Value: $1,104,000 - $1,249,000
4
Beds
5
Baths
4,198
Sq Ft
$279/Sq Ft
Est. Value
About This Home
This home is located at 3555 Grey Abbey Dr Unit II, Alpharetta, GA 30022 and is currently estimated at $1,172,981, approximately $279 per square foot. 3555 Grey Abbey Dr Unit II is a home located in Fulton County with nearby schools including New Prospect Elementary School, Webb Bridge Middle School, and Alpharetta High School.
Ownership History
Date
Name
Owned For
Owner Type
Purchase Details
Closed on
Jul 25, 2002
Sold by
Kurek Christopher A and Kurek Sue A
Bought by
Biggs Michael A and Biggs Kimberly W
Current Estimated Value
Home Financials for this Owner
Home Financials are based on the most recent Mortgage that was taken out on this home.
Original Mortgage
$402,400
Outstanding Balance
$169,496
Interest Rate
6.62%
Mortgage Type
New Conventional
Estimated Equity
$1,003,485
Purchase Details
Closed on
Apr 8, 1998
Sold by
Krs Builders Inc
Bought by
Kurek Christopher A
Home Financials for this Owner
Home Financials are based on the most recent Mortgage that was taken out on this home.
Original Mortgage
$360,000
Interest Rate
7.03%
Mortgage Type
New Conventional
Purchase Details
Closed on
Oct 14, 1997
Sold by
Jim Cowart Inc
Bought by
Krs Bldrs Inc
Home Financials for this Owner
Home Financials are based on the most recent Mortgage that was taken out on this home.
Original Mortgage
$299,925
Interest Rate
7.55%
Mortgage Type
New Conventional
Create a Home Valuation Report for This Property
The Home Valuation Report is an in-depth analysis detailing your home's value as well as a comparison with similar homes in the area
Home Values in the Area
Average Home Value in this Area
Purchase History
| Date | Buyer | Sale Price | Title Company |
|---|---|---|---|
| Biggs Michael A | $503,000 | -- | |
| Kurek Christopher A | $450,000 | -- | |
| Krs Bldrs Inc | $81,400 | -- |
Source: Public Records
Mortgage History
| Date | Status | Borrower | Loan Amount |
|---|---|---|---|
| Open | Biggs Michael A | $402,400 | |
| Previous Owner | Kurek Christopher A | $360,000 | |
| Previous Owner | Krs Bldrs Inc | $299,925 |
Source: Public Records
Tax History Compared to Growth
Tax History
| Year | Tax Paid | Tax Assessment Tax Assessment Total Assessment is a certain percentage of the fair market value that is determined by local assessors to be the total taxable value of land and additions on the property. | Land | Improvement |
|---|---|---|---|---|
| 2025 | $1,447 | $426,320 | $128,120 | $298,200 |
| 2023 | $10,211 | $361,760 | $64,480 | $297,280 |
| 2022 | $6,567 | $295,920 | $47,360 | $248,560 |
| 2021 | $7,791 | $263,480 | $47,280 | $216,200 |
| 2020 | $7,857 | $271,720 | $36,000 | $235,720 |
| 2019 | $1,233 | $266,920 | $35,360 | $231,560 |
| 2018 | $6,833 | $260,640 | $34,520 | $226,120 |
| 2017 | $6,497 | $234,640 | $36,400 | $198,240 |
| 2016 | $6,497 | $234,640 | $36,400 | $198,240 |
| 2015 | $7,673 | $234,640 | $36,400 | $198,240 |
| 2014 | $6,298 | $218,200 | $33,840 | $184,360 |
Source: Public Records
Map
Nearby Homes
- 10845 Carrissa Trail
- 465 Kirkstall Trail
- 10900 Wittenridge Dr Unit I3
- 10900 Wittenridge Dr Unit H8
- 10900 Wittenridge Dr Unit L6
- 345 Kincardine Way Unit IIIA
- 870 Longstone Landing
- 125 Sandridge Ct
- 10880 Windham Way
- 610 Varina Way
- 825 Highland Bend Cove
- 105 Kimball Bridge Cove
- 3010 Brooke View Ct Unit 5
- 3962 Erin Dr
- 4255 Park Brooke Trace
- 3396 Carverton Ln
- 355 Fairleaf Ct
- 4345 Park Brooke Trace
- 3545 Grey Abbey Dr
- 3751 Cape York Trace
- 3751 Cape York Trace
- 3741 Cape York Trace
- 3731 Cape York Trace Unit 2
- 3560 Grey Abbey Dr
- 3570 Grey Abbey Dr Unit 2
- 3535 Grey Abbey Dr
- 3721 Cape York Trace
- 3550 Grey Abbey Dr
- 3580 Grey Abbey Dr
- 3772 Cape York Trace
- 3772 Cape York Trace
- 305 Eddystone Point Unit II
- 3752 Cape York Trace
- 3752 Cape York Trace
- 3722 Cape York Trace
- 3742 Cape York Trace
- 3722 Cape York Trace Unit 2
- 3732 Cape York Trace