Estimated Value: $553,000 - $603,000
6
Beds
3
Baths
3,440
Sq Ft
$167/Sq Ft
Est. Value
About This Home
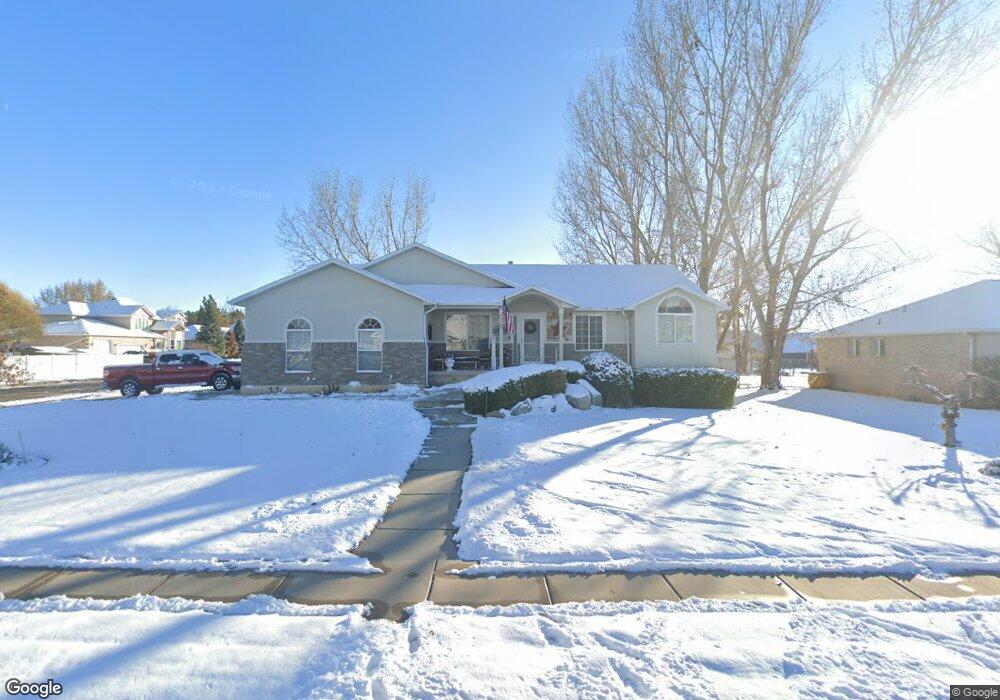
This home is located at 3555 W 5700 S, Roy, UT 84067 and is currently estimated at $574,255, approximately $166 per square foot. 3555 W 5700 S is a home located in Weber County with nearby schools including Midland School, Roy Junior High School, and Roy High School.
Ownership History
Date
Name
Owned For
Owner Type
Purchase Details
Closed on
Jun 1, 2005
Sold by
Cendant Mobility Services Corp
Bought by
Johnson Mark C and Johnson Molly J
Current Estimated Value
Home Financials for this Owner
Home Financials are based on the most recent Mortgage that was taken out on this home.
Original Mortgage
$171,600
Interest Rate
5.46%
Mortgage Type
Fannie Mae Freddie Mac
Purchase Details
Closed on
Apr 29, 2005
Sold by
Morrison Kelly D and Morrison Kathy
Bought by
Cendant Mobility Services Corp
Home Financials for this Owner
Home Financials are based on the most recent Mortgage that was taken out on this home.
Original Mortgage
$171,600
Interest Rate
5.46%
Mortgage Type
Fannie Mae Freddie Mac
Create a Home Valuation Report for This Property
The Home Valuation Report is an in-depth analysis detailing your home's value as well as a comparison with similar homes in the area
Home Values in the Area
Average Home Value in this Area
Purchase History
| Date | Buyer | Sale Price | Title Company |
|---|---|---|---|
| Johnson Mark C | -- | First American Title | |
| Cendant Mobility Services Corp | -- | First American Title |
Source: Public Records
Mortgage History
| Date | Status | Borrower | Loan Amount |
|---|---|---|---|
| Closed | Johnson Mark C | $42,900 | |
| Previous Owner | Johnson Mark C | $171,600 |
Source: Public Records
Tax History Compared to Growth
Tax History
| Year | Tax Paid | Tax Assessment Tax Assessment Total Assessment is a certain percentage of the fair market value that is determined by local assessors to be the total taxable value of land and additions on the property. | Land | Improvement |
|---|---|---|---|---|
| 2025 | $3,569 | $578,834 | $175,636 | $403,198 |
| 2024 | $3,484 | $312,949 | $96,599 | $216,350 |
| 2023 | $3,363 | $302,500 | $96,497 | $206,003 |
| 2022 | $3,226 | $296,450 | $77,206 | $219,244 |
| 2021 | $2,783 | $422,000 | $85,258 | $336,742 |
| 2020 | $2,616 | $364,000 | $85,258 | $278,742 |
| 2019 | $2,538 | $333,000 | $64,993 | $268,007 |
| 2018 | $2,484 | $308,000 | $64,993 | $243,007 |
| 2017 | $2,449 | $286,000 | $55,014 | $230,986 |
| 2016 | $2,334 | $146,598 | $30,261 | $116,337 |
| 2015 | $2,170 | $139,784 | $35,712 | $104,072 |
| 2014 | $2,202 | $140,642 | $35,712 | $104,930 |
Source: Public Records
Map
Nearby Homes