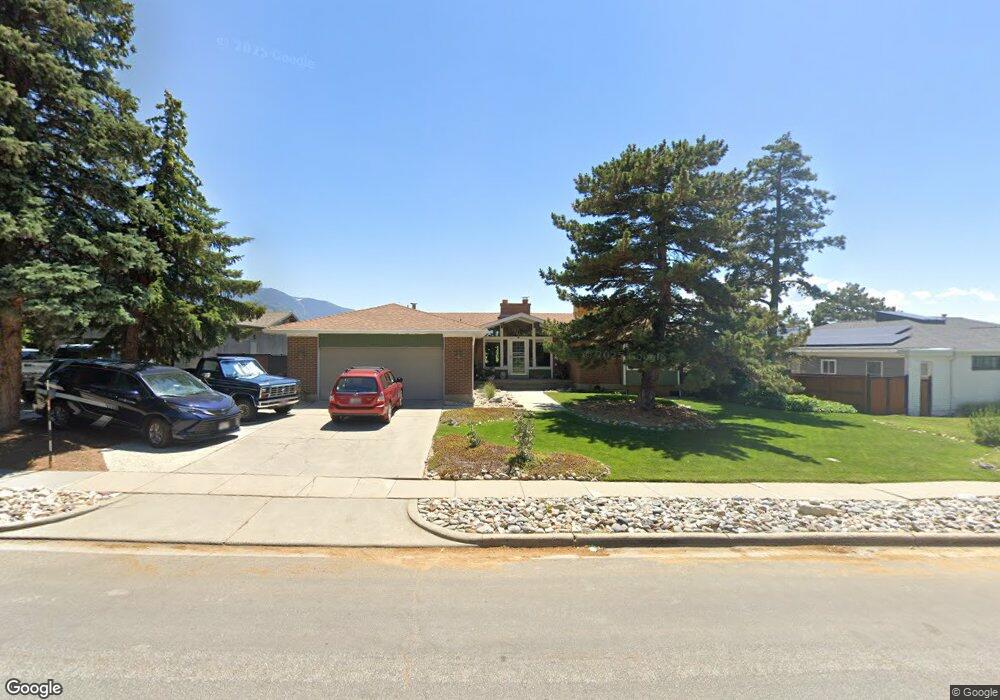
3556 Brighton Point Dr Salt Lake City, UT 84121
Estimated Value: $862,000 - $1,083,000
4
Beds
3
Baths
3,667
Sq Ft
$254/Sq Ft
Est. Value
About This Home
This home is located at 3556 Brighton Point Dr, Salt Lake City, UT 84121 and is currently estimated at $931,162, approximately $253 per square foot. 3556 Brighton Point Dr is a home located in Salt Lake County with nearby schools including Canyon View School, Butler Middle School, and Brighton High School.
Ownership History
Date
Name
Owned For
Owner Type
Purchase Details
Closed on
Apr 29, 2009
Sold by
Eggleton Andrea
Bought by
Knaak James J
Current Estimated Value
Home Financials for this Owner
Home Financials are based on the most recent Mortgage that was taken out on this home.
Original Mortgage
$265,000
Outstanding Balance
$168,691
Interest Rate
4.99%
Mortgage Type
Unknown
Estimated Equity
$762,471
Purchase Details
Closed on
Mar 27, 2008
Sold by
Evans Jeremy O and Evans Maureen W
Bought by
Eggleton Andrea
Purchase Details
Closed on
Dec 5, 2003
Sold by
Searle Chris and Searle Gina
Bought by
Evans Jeremy O and Evans Maureen W
Home Financials for this Owner
Home Financials are based on the most recent Mortgage that was taken out on this home.
Original Mortgage
$250,990
Interest Rate
5.25%
Mortgage Type
Unknown
Purchase Details
Closed on
Mar 27, 2001
Sold by
Lundgren Dan H and Lundgren Linda D
Bought by
Searle Chris and Searle Gina
Home Financials for this Owner
Home Financials are based on the most recent Mortgage that was taken out on this home.
Original Mortgage
$164,800
Interest Rate
7.06%
Create a Home Valuation Report for This Property
The Home Valuation Report is an in-depth analysis detailing your home's value as well as a comparison with similar homes in the area
Home Values in the Area
Average Home Value in this Area
Purchase History
| Date | Buyer | Sale Price | Title Company |
|---|---|---|---|
| Knaak James J | -- | 1St National Title Ins Agenc | |
| Eggleton Andrea | -- | 1St National Title Ins Agenc | |
| Evans Jeremy O | -- | Monument Title Ins Co | |
| Searle Chris | -- | Superior Title |
Source: Public Records
Mortgage History
| Date | Status | Borrower | Loan Amount |
|---|---|---|---|
| Open | Knaak James J | $265,000 | |
| Previous Owner | Evans Jeremy O | $250,990 | |
| Previous Owner | Searle Chris | $164,800 | |
| Closed | Searle Chris | $20,600 |
Source: Public Records
Tax History Compared to Growth
Tax History
| Year | Tax Paid | Tax Assessment Tax Assessment Total Assessment is a certain percentage of the fair market value that is determined by local assessors to be the total taxable value of land and additions on the property. | Land | Improvement |
|---|---|---|---|---|
| 2025 | $4,093 | $790,000 | $337,400 | $452,600 |
| 2024 | $4,093 | $729,900 | $324,800 | $405,100 |
| 2023 | $3,624 | $628,400 | $312,400 | $316,000 |
| 2022 | $3,843 | $657,500 | $306,200 | $351,300 |
| 2021 | $4,091 | $582,500 | $242,900 | $339,600 |
| 2020 | $3,771 | $504,600 | $233,500 | $271,100 |
| 2019 | $3,760 | $488,600 | $220,300 | $268,300 |
| 2018 | $3,491 | $471,700 | $220,300 | $251,400 |
| 2017 | $3,190 | $418,100 | $220,300 | $197,800 |
| 2016 | $2,828 | $359,500 | $198,500 | $161,000 |
| 2015 | $2,828 | $333,100 | $210,400 | $122,700 |
| 2014 | $2,773 | $317,500 | $204,500 | $113,000 |
Source: Public Records
Map
Nearby Homes
- 3603 E Macintosh Ln
- 3404 Enchanted Hills Dr
- 5830 S Wasatch Blvd
- 7367 Canyon Centre Pkwy
- 3599 Avondale Dr
- 7726 S 3500 E
- 7581 S Prospector Dr
- 7736 S Avondale Dr
- 7657 Avondale Dr
- 7541 S Prospector Dr E
- 7622 S Cambria Cir
- 7732 Timberline Dr
- 7931 S Norwood Rd
- 3071 E 7335 S
- 7911 Willowcrest Rd
- 4006 E Canyon Estate Dr
- 8027 S Top of The World Dr
- 7077 S City View Dr Unit 15
- 7077 S City View Dr
- 3983 E Canyon Estate Dr Unit 31
- 3556 E Brighton Point Dr
- 3540 Brighton Point Dr
- 3540 E Brighton Point Dr
- 3594 Brighton Point Dr
- 3594 E Brighton Point S
- 3594 E Brighton Point Dr
- 3545 Country Hollow Dr
- 3533 Country Hollow Dr
- 3526 Brighton Point Dr
- 3608 Brighton Point Dr
- 3608 E Brighton Point Dr
- 3555 E Country Hollow Dr
- 3555 Country Hollow Dr
- 3553 E Brighton Point Dr
- 3523 E Country Hollow Dr
- 3523 Country Hollow Dr
- 3567 E Brighton Point Dr
- 3539 E Brighton Point Dr
- 3599 E Brighton Point Dr
- 3567 Country Hollow Dr