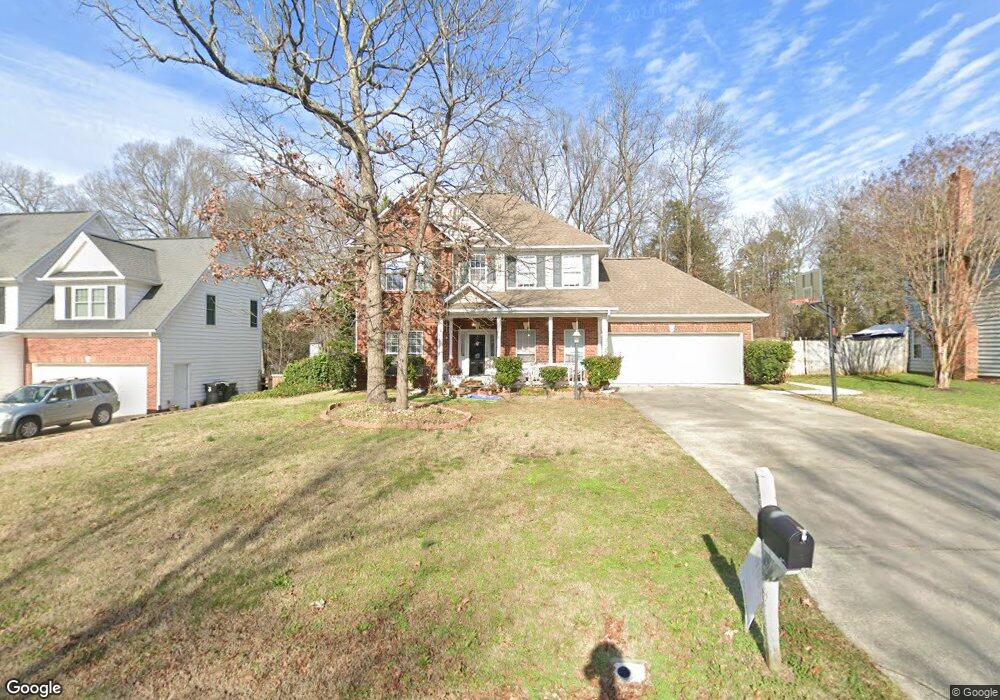
3557 Cedar Springs Dr SW Concord, NC 28027
Estimated Value: $399,179 - $423,000
3
Beds
3
Baths
1,937
Sq Ft
$213/Sq Ft
Est. Value
About This Home
This home is located at 3557 Cedar Springs Dr SW, Concord, NC 28027 and is currently estimated at $412,545, approximately $212 per square foot. 3557 Cedar Springs Dr SW is a home located in Cabarrus County with nearby schools including Wolf Meadow Elementary School, Roberta Road Middle School, and Jay M. Robinson High School.
Ownership History
Date
Name
Owned For
Owner Type
Purchase Details
Closed on
Nov 13, 2023
Sold by
Voss Family Living Trust
Bought by
Voss Larry Leroy and Voss Rhonda Blanton
Current Estimated Value
Purchase Details
Closed on
Oct 21, 2020
Sold by
Voss Larry Leroy and Voss Rhonda Blanton
Bought by
Voss Larry Leron and Voss Rhonda Blanton
Purchase Details
Closed on
Aug 23, 2001
Sold by
Barrier Walter H and Barrier Briana T
Bought by
Voss Larry L
Home Financials for this Owner
Home Financials are based on the most recent Mortgage that was taken out on this home.
Original Mortgage
$129,600
Interest Rate
7.18%
Purchase Details
Closed on
Feb 19, 1998
Sold by
Guinn David E and Leckwart Renee
Bought by
Barrier Walter H and Barrier Briana T
Home Financials for this Owner
Home Financials are based on the most recent Mortgage that was taken out on this home.
Original Mortgage
$144,000
Interest Rate
6.89%
Purchase Details
Closed on
May 1, 1995
Create a Home Valuation Report for This Property
The Home Valuation Report is an in-depth analysis detailing your home's value as well as a comparison with similar homes in the area
Home Values in the Area
Average Home Value in this Area
Purchase History
| Date | Buyer | Sale Price | Title Company |
|---|---|---|---|
| Voss Larry Leroy | -- | None Listed On Document | |
| Voss Larry Leron | -- | None Available | |
| Voss Larry L | $162,000 | -- | |
| Barrier Walter H | $153,000 | -- | |
| -- | $137,500 | -- |
Source: Public Records
Mortgage History
| Date | Status | Borrower | Loan Amount |
|---|---|---|---|
| Previous Owner | Voss Larry L | $129,600 | |
| Previous Owner | Barrier Walter H | $144,000 |
Source: Public Records
Tax History Compared to Growth
Tax History
| Year | Tax Paid | Tax Assessment Tax Assessment Total Assessment is a certain percentage of the fair market value that is determined by local assessors to be the total taxable value of land and additions on the property. | Land | Improvement |
|---|---|---|---|---|
| 2025 | $3,507 | $352,100 | $80,000 | $272,100 |
| 2024 | $3,507 | $352,100 | $80,000 | $272,100 |
| 2023 | $2,701 | $221,410 | $45,000 | $176,410 |
| 2022 | $2,701 | $221,410 | $45,000 | $176,410 |
| 2021 | $2,701 | $221,410 | $45,000 | $176,410 |
| 2020 | $2,701 | $221,410 | $45,000 | $176,410 |
| 2019 | $2,194 | $179,840 | $30,000 | $149,840 |
| 2018 | $2,158 | $179,840 | $30,000 | $149,840 |
| 2017 | $2,122 | $179,840 | $30,000 | $149,840 |
| 2016 | $1,259 | $172,000 | $30,000 | $142,000 |
| 2015 | $1,972 | $167,110 | $30,000 | $137,110 |
| 2014 | $1,972 | $167,110 | $30,000 | $137,110 |
Source: Public Records
Map
Nearby Homes
- 3807 Bent Creek Dr SW
- 3811 Bent Creek Dr SW
- 3141 Yates Mill Dr SW
- 3333 Roberta Rd
- 4370 Coddle Creek Dr
- 3369 Roberta Rd
- 3455 Roberta Rd
- 5366 Hardister Place
- 3133 Roberta Rd
- 3913 Stough Rd
- 4349 Roberta Rd
- 4104 Pebblebrook Cir SW
- 3011 Langhorne Ave SW
- 4114 Carolina Pointe Ct SW
- 4112 Alexis Ct SW
- 3673 Farm Lake Dr SW
- 1398 Kent Downs Ave SW Unit 52
- 287 Halton Crossing Dr SW
- 706 King Fredrick Ln SW
- 3174 Farmwood Blvd SW Unit 154
- 3561 Cedar Springs Dr SW
- 3553 Cedar Springs Dr SW
- 3354 Newburg Place SW
- 3565 Cedar Springs Dr SW
- 3549 Cedar Springs Dr SW
- 3355 Newburg Place SW
- 3556 Cedar Springs Dr SW
- 3251 Roberta Farms Ct SW
- 3560 Cedar Springs Dr SW
- 3552 Cedar Springs Dr SW
- 3569 Cedar Springs Dr SW
- 3545 Cedar Springs Dr SW
- 3255 Roberta Farms Ct SW
- 3350 Newburg Place SW
- 3564 Cedar Springs Dr SW
- 3350 Newberg Place SW
- 3544 Cedar Springs Dr SW
- 3568 Cedar Springs Dr SW
- 3351 Newburg Place SW
- 3573 Cedar Springs Dr SW