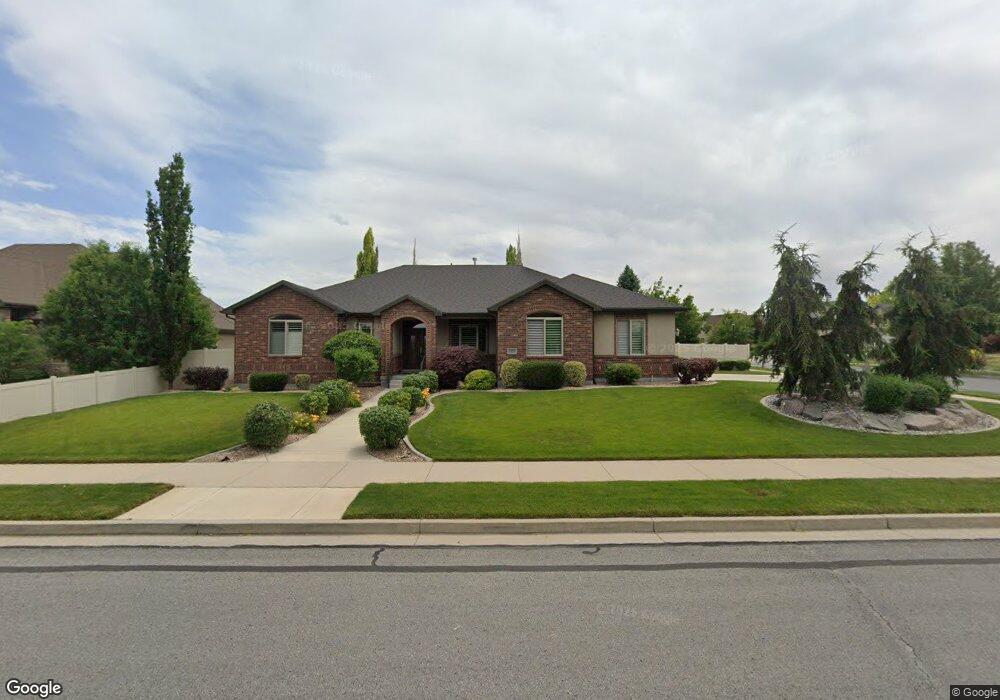
3557 W 10235 S Unit 330 South Jordan, UT 84095
Estimated Value: $897,000 - $1,036,000
4
Beds
3
Baths
3,888
Sq Ft
$245/Sq Ft
Est. Value
About This Home
This home is located at 3557 W 10235 S Unit 330, South Jordan, UT 84095 and is currently estimated at $951,172, approximately $244 per square foot. 3557 W 10235 S Unit 330 is a home located in Salt Lake County with nearby schools including Elk Meadows Elementary School, Elk Ridge Middle School, and Mountain West Montessori Academy.
Ownership History
Date
Name
Owned For
Owner Type
Purchase Details
Closed on
Apr 22, 2018
Sold by
Flynn Craig
Bought by
Flynn Craig P and Flynn Jessica
Current Estimated Value
Purchase Details
Closed on
Apr 28, 2015
Sold by
Stutz Karen W
Bought by
Flynn Craig
Purchase Details
Closed on
Dec 1, 2014
Sold by
Bangerter Homes Llc
Bought by
Stutz Karen W and Stutz Family Trust
Purchase Details
Closed on
Jan 16, 2014
Sold by
Vanvanwermeskerken Nicholaas Van and Wermeskerken Marianne Van
Bought by
Bangerter Homes Llc
Purchase Details
Closed on
Sep 16, 2005
Sold by
Bangerter Homes Llc
Bought by
Vanwermeskerken Nicholaas and Van Wermeskerken Marianne
Purchase Details
Closed on
Aug 18, 2005
Sold by
Jsb Corp
Bought by
Bangerter Homes
Purchase Details
Closed on
Jun 1, 2005
Sold by
Jones Ruth S
Bought by
Jsb Corp
Create a Home Valuation Report for This Property
The Home Valuation Report is an in-depth analysis detailing your home's value as well as a comparison with similar homes in the area
Home Values in the Area
Average Home Value in this Area
Purchase History
| Date | Buyer | Sale Price | Title Company |
|---|---|---|---|
| Flynn Craig P | -- | None Available | |
| Flynn Craig | -- | Bay National Title Co | |
| Stutz Karen W | -- | Metro National Title | |
| Bangerter Homes Llc | -- | Metro National Title | |
| Vanwermeskerken Nicholaas | -- | Merrill Title | |
| Bangerter Homes | -- | Integrated Title Ins Svcs | |
| Jsb Corp | -- | Integrated Title Ins Svcs |
Source: Public Records
Tax History Compared to Growth
Tax History
| Year | Tax Paid | Tax Assessment Tax Assessment Total Assessment is a certain percentage of the fair market value that is determined by local assessors to be the total taxable value of land and additions on the property. | Land | Improvement |
|---|---|---|---|---|
| 2025 | $4,714 | $919,400 | $273,300 | $646,100 |
| 2024 | $4,714 | $895,000 | $260,300 | $634,700 |
| 2023 | $4,688 | $839,800 | $252,700 | $587,100 |
| 2022 | $4,844 | $850,600 | $247,700 | $602,900 |
| 2021 | $3,857 | $621,400 | $204,800 | $416,600 |
| 2020 | $3,781 | $570,900 | $204,800 | $366,100 |
| 2019 | $3,627 | $538,400 | $174,400 | $364,000 |
| 2018 | $3,449 | $509,400 | $173,400 | $336,000 |
| 2017 | $3,375 | $488,500 | $170,400 | $318,100 |
| 2016 | $3,443 | $472,200 | $157,600 | $314,600 |
| 2015 | $2,904 | $387,300 | $159,000 | $228,300 |
| 2014 | $1,279 | $92,200 | $92,200 | $0 |
Source: Public Records
Map
Nearby Homes
- 10252 S 3570 W
- 3651 W 10200 S Unit 11
- Raddison Plan at Eagles Landing
- Wembly Plan at Eagles Landing
- Whitmore Plan at Eagles Landing
- Richmond Plan at Eagles Landing
- Regal Plan at Eagles Landing
- Wesley Plan at Eagles Landing
- 3667 S Jordan Pkwy W
- 3312 W Harvest Grove Way
- 10164 Birnam Woods Way
- 3274 W Harvest Chase Dr
- 10339 S Cold Moon Place
- 3928 W Kilt St
- 10489 S Harvest Glory Dr
- 10447 S Garden Sage Cir
- 3878 W Sage Willow Dr
- 3211 W Harvest Glory Dr
- 10605 Willow Valley Rd
- 1553 W Banner Dr Unit 844
- 3557 W 10235 S
- 3537 W 10235 S
- 10289 S 3570 W
- 3548 W 10305 S
- 3534 W 10305 S
- 10266 S 3570 W
- 3558 W 10235 S
- 3517 W 10235 S
- 3538 W 10235 S Unit 620
- 3538 W 10235 S Unit 306
- 10284 S 3570 W
- 3518 W 10305 S
- 3574 W 10235 S
- 10232 S 3570 W
- 3514 W 10235 S
- 3497 W 10235 S
- 3497 W 10235 S Unit lt 333
- 3502 W 10305 S
- 3502 W 10305 S Unit 326JF
- 3502 W 10305 S Unit LOT326