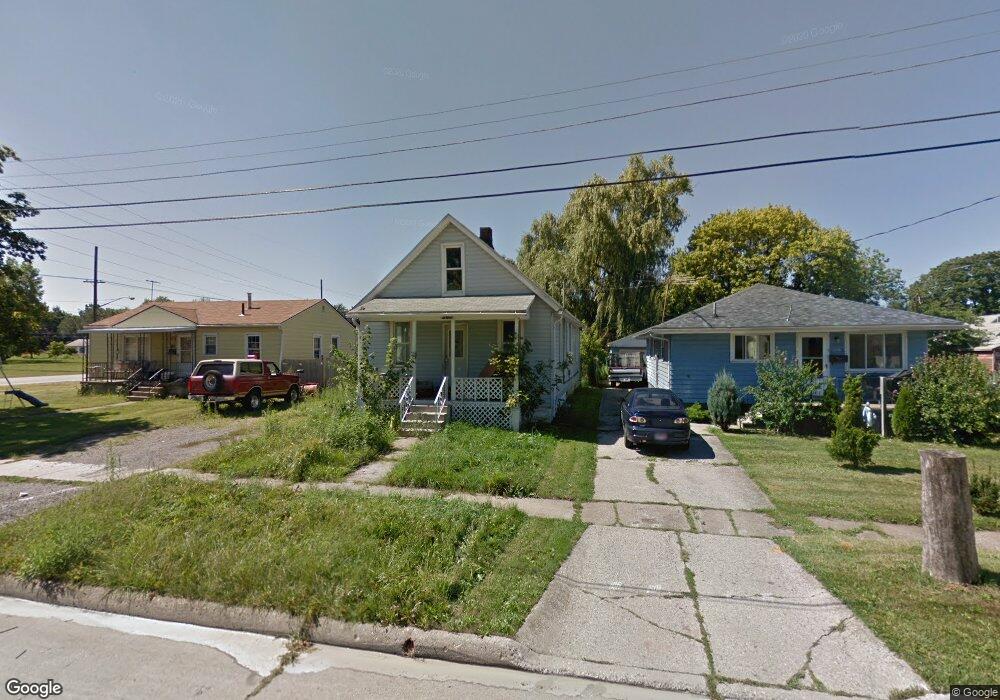
3558 Canton Ave Lorain, OH 44055
Estimated Value: $59,000 - $93,000
3
Beds
1
Bath
926
Sq Ft
$80/Sq Ft
Est. Value
About This Home
This home is located at 3558 Canton Ave, Lorain, OH 44055 and is currently estimated at $73,694, approximately $79 per square foot. 3558 Canton Ave is a home located in Lorain County with nearby schools including Stevan Dohanos Elementary School, Southview Middle School, and Lorain High School.
Ownership History
Date
Name
Owned For
Owner Type
Purchase Details
Closed on
Jan 4, 2023
Sold by
Tnew Llc
Bought by
Toth Michael
Current Estimated Value
Purchase Details
Closed on
Jul 11, 2022
Sold by
Thomas Newson
Bought by
Tnew Llc
Purchase Details
Closed on
Jun 30, 2021
Sold by
Abw Properties Llc
Bought by
Newson Thomas
Purchase Details
Closed on
Feb 23, 2021
Sold by
Chesnut Eq R6 Llc
Bought by
Abe Properties Llc
Purchase Details
Closed on
Jul 26, 2019
Sold by
Home Opportunity Llc
Bought by
Chestnut Eq R6 Llc
Purchase Details
Closed on
Apr 17, 2013
Sold by
Transportation Alliance Bank Inc
Bought by
Home Opportunity Llc
Purchase Details
Closed on
Jun 13, 2012
Sold by
Home Solutions Partner I Reo Llc
Bought by
Transportation Alliance Bank Inc
Purchase Details
Closed on
Nov 13, 2009
Sold by
Simpson Paul R and Simpson Caroline S
Bought by
Home Solutions Partners I Reo Llc
Create a Home Valuation Report for This Property
The Home Valuation Report is an in-depth analysis detailing your home's value as well as a comparison with similar homes in the area
Home Values in the Area
Average Home Value in this Area
Purchase History
| Date | Buyer | Sale Price | Title Company |
|---|---|---|---|
| Toth Michael | $600 | -- | |
| Tnew Llc | $3,500 | None Listed On Document | |
| Newson Thomas | $3,500 | None Available | |
| Abe Properties Llc | $1,000 | None Available | |
| Chestnut Eq R6 Llc | $396 | None Available | |
| Home Opportunity Llc | -- | None Available | |
| Transportation Alliance Bank Inc | $17,945 | None Available | |
| Home Solutions Partners I Reo Llc | -- | Nationwide Title Clearing |
Source: Public Records
Tax History Compared to Growth
Tax History
| Year | Tax Paid | Tax Assessment Tax Assessment Total Assessment is a certain percentage of the fair market value that is determined by local assessors to be the total taxable value of land and additions on the property. | Land | Improvement |
|---|---|---|---|---|
| 2024 | $589 | $13,930 | $1,950 | $11,981 |
| 2023 | $808 | $15,299 | $2,779 | $12,520 |
| 2022 | $801 | $15,299 | $2,779 | $12,520 |
| 2021 | $801 | $15,299 | $2,779 | $12,520 |
| 2020 | $816 | $13,530 | $2,460 | $11,070 |
| 2019 | $811 | $13,530 | $2,460 | $11,070 |
| 2018 | $741 | $13,530 | $2,460 | $11,070 |
| 2017 | $670 | $10,530 | $2,580 | $7,950 |
| 2016 | $665 | $10,530 | $2,580 | $7,950 |
| 2015 | $628 | $10,530 | $2,580 | $7,950 |
| 2014 | $609 | $9,750 | $2,390 | $7,360 |
| 2013 | $576 | $9,750 | $2,390 | $7,360 |
Source: Public Records
Map
Nearby Homes
- 3535 Clifton Ave
- 0 Canton Ave
- 3825 Canton Ave
- 3781 Lowell Ave
- 216 E 33rd St
- 3177 Elyria Ave
- 000 Dewitt St
- 3026 Caroline Ave
- 2909 Denver Ave
- 3266 Livingston Ave
- 3242 Reid Ave
- 3964 Josephine St
- V/L Broadway Ave
- 0 Toledo Ave Unit 5129967
- 1536 E 29th St
- 314 E 26th St
- 325 W 31st St
- 4137 Dunton Rd
- 206 W 29th St
- 1633 E 33rd St
- 3550 Canton Ave
- 3570 Canton Ave
- 3534 Canton Ave
- 3571 Clifton Ave
- 3551 Canton Ave
- 903 E 36th St
- 3543 Canton Ave
- 3527 Clifton Ave
- 3526 Canton Ave
- 3541 Canton Ave
- 3622 Canton Ave
- 814 E 35th St
- 3519 Canton Ave
- 3511 Clifton Ave
- 911 E 36th St
- 3560 Clifton Ave
- 3550 Clifton Ave
- 3511 Canton Ave
- 3570 Clifton Ave
- 3542 Clifton Ave