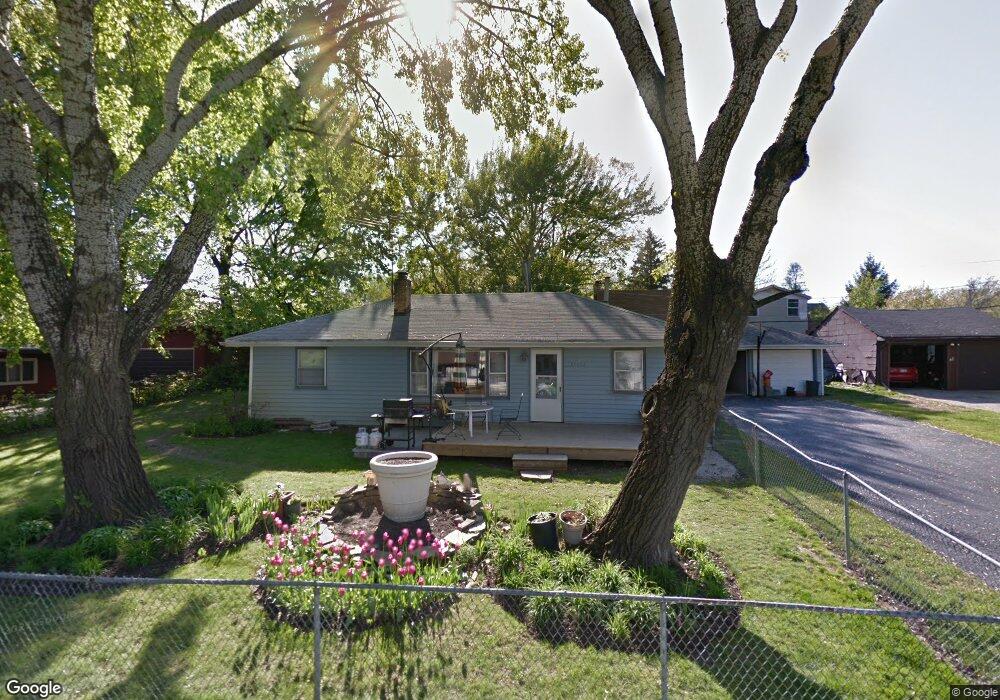
35584 N Everett Ave Ingleside, IL 60041
Estimated Value: $196,239 - $262,000
Studio
1
Bath
1,150
Sq Ft
$195/Sq Ft
Est. Value
About This Home
This home is located at 35584 N Everett Ave, Ingleside, IL 60041 and is currently estimated at $224,060, approximately $194 per square foot. 35584 N Everett Ave is a home located in Lake County with nearby schools including Gavin Central Elementary School, Gavin South Middle School, and Grant Community High School.
Ownership History
Date
Name
Owned For
Owner Type
Purchase Details
Closed on
Aug 27, 2025
Sold by
Andrade Artemio
Bought by
Andrade Artemio and Cervantes Kevin
Current Estimated Value
Purchase Details
Closed on
Feb 18, 2004
Sold by
Valle Celina R and Andrade Jova
Bought by
Andrade Artemio and Andrade Jova
Home Financials for this Owner
Home Financials are based on the most recent Mortgage that was taken out on this home.
Original Mortgage
$108,450
Interest Rate
5.71%
Mortgage Type
New Conventional
Purchase Details
Closed on
Jul 25, 2001
Sold by
Hudzenko Celina and Valle Celina R
Bought by
Valle Celina R and Andrade Jova
Home Financials for this Owner
Home Financials are based on the most recent Mortgage that was taken out on this home.
Original Mortgage
$112,200
Interest Rate
8.4%
Create a Home Valuation Report for This Property
The Home Valuation Report is an in-depth analysis detailing your home's value as well as a comparison with similar homes in the area
Home Values in the Area
Average Home Value in this Area
Purchase History
| Date | Buyer | Sale Price | Title Company |
|---|---|---|---|
| Andrade Artemio | -- | None Listed On Document | |
| Andrade Artemio | -- | -- | |
| Valle Celina R | -- | -- |
Source: Public Records
Mortgage History
| Date | Status | Borrower | Loan Amount |
|---|---|---|---|
| Previous Owner | Andrade Artemio | $108,450 | |
| Previous Owner | Valle Celina R | $112,200 |
Source: Public Records
Tax History
| Year | Tax Paid | Tax Assessment Tax Assessment Total Assessment is a certain percentage of the fair market value that is determined by local assessors to be the total taxable value of land and additions on the property. | Land | Improvement |
|---|---|---|---|---|
| 2024 | $3,489 | $61,904 | $9,885 | $52,019 |
| 2023 | $3,305 | $52,949 | $9,312 | $43,637 |
| 2022 | $3,305 | $47,618 | $7,520 | $40,098 |
| 2021 | $3,031 | $43,083 | $7,088 | $35,995 |
| 2020 | $2,853 | $39,424 | $6,987 | $32,437 |
| 2019 | $2,748 | $37,806 | $6,700 | $31,106 |
| 2018 | $2,025 | $29,592 | $6,305 | $23,287 |
| 2017 | $1,965 | $27,352 | $5,828 | $21,524 |
| 2016 | $2,021 | $25,015 | $5,330 | $19,685 |
| 2015 | $1,876 | $21,715 | $4,975 | $16,740 |
| 2014 | $1,821 | $22,747 | $10,159 | $12,588 |
| 2012 | $1,992 | $22,488 | $10,586 | $11,902 |
Source: Public Records
Map
Nearby Homes
- 25616 W Lake Shore Dr
- 35720 N Laurel Ave
- 35706 N Benjamin Ave
- 35737 N Hunt Ave
- 26179 W Tarvin Ln
- 36138 N Tara Ct
- 35080 N Ellen Dr
- 34906 N Augustana Ave
- 35063 N Emerald Shores Ct
- 25815 W Hilltop Dr
- 36409 N Tara Ct
- 26276 W Larkin Ln
- 24731 W Orchard Place
- 26297 W Larkin Ln
- 35105 N Ingleside Dr
- 35563 N Hillside Ave
- 35025 N Ingleside Dr
- 36440 N Westmoor Ave
- 605 Rollins Rd
- 26203 W Grand Ave
- 35583 N Tami Ln
- 35614 N Everett Ave
- 35591 N Tami Ln
- 35566 N Everett Ave
- 35571 N Tami Ln
- 35591 N Everett Ave
- 35583 N Everett Ave
- 35565 N Tami Ln
- 25589 W Lake Shore Dr
- 35571 N Everett Ave
- 35565 N Everett Ave
- 35553 N Tami Ln
- 35580 N Tami Ln
- 35553 N Everett Ave
- 35592 N Tami Ln
- 35570 N Tami Ln
- 25588 W Lake Shore Dr
- 35537 N Tami Ln
- 35614 N Tami Ln
- 35558 N Tami Ln
Your Personal Tour Guide
Ask me questions while you tour the home.