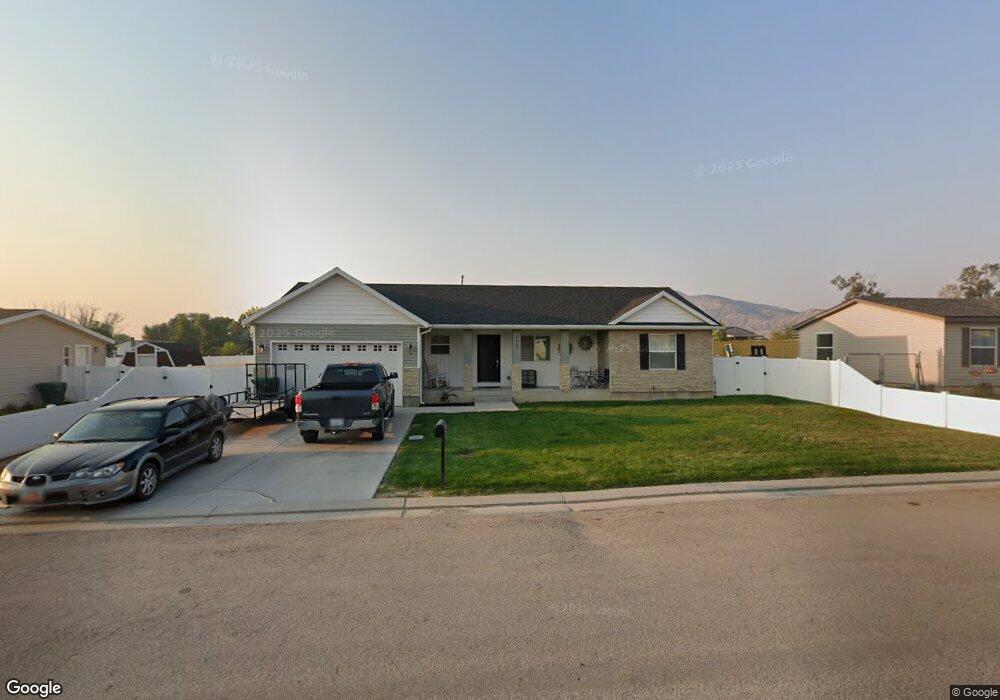
3559 W 700 N Vernal, UT 84078
Estimated Value: $349,000
3
Beds
2
Baths
1,632
Sq Ft
$214/Sq Ft
Est. Value
About This Home
This home is located at 3559 W 700 N, Vernal, UT 84078 and is currently priced at $349,000, approximately $213 per square foot. 3559 W 700 N is a home located in Uintah County with nearby schools including Maeser School, Uintah Middle School, and Vernal Middle School.
Ownership History
Date
Name
Owned For
Owner Type
Purchase Details
Closed on
Apr 19, 2022
Sold by
Nazzise Cassie Leigh and Nazzise Zachary Sam
Bought by
Park Jordan and Kitamura Lia
Current Estimated Value
Home Financials for this Owner
Home Financials are based on the most recent Mortgage that was taken out on this home.
Original Mortgage
$313,000
Outstanding Balance
$297,989
Interest Rate
5%
Mortgage Type
VA
Purchase Details
Closed on
May 17, 2021
Sold by
Slaugh Cassie L and Nazzise Zachary S
Bought by
Nazzise Cassie L and Nazzine Zachary S
Home Financials for this Owner
Home Financials are based on the most recent Mortgage that was taken out on this home.
Original Mortgage
$230,158
Interest Rate
3%
Mortgage Type
Stand Alone Refi Refinance Of Original Loan
Purchase Details
Closed on
Jan 30, 2009
Sold by
Hacking Rulon C
Bought by
Brenny Richard and Brenny Sally
Home Financials for this Owner
Home Financials are based on the most recent Mortgage that was taken out on this home.
Original Mortgage
$128,500
Interest Rate
5.14%
Mortgage Type
Construction
Create a Home Valuation Report for This Property
The Home Valuation Report is an in-depth analysis detailing your home's value as well as a comparison with similar homes in the area
Home Values in the Area
Average Home Value in this Area
Purchase History
| Date | Buyer | Sale Price | Title Company |
|---|---|---|---|
| Park Jordan | -- | Basin Land Title | |
| Park Jordan | -- | Basin Land Title | |
| Park Jordan | -- | Basin Land Title | |
| Nazzise Cassie L | -- | None Available | |
| Brenny Richard | -- | -- |
Source: Public Records
Mortgage History
| Date | Status | Borrower | Loan Amount |
|---|---|---|---|
| Open | Park Jordan | $313,000 | |
| Closed | Park Jordan | $313,000 | |
| Previous Owner | Nazzise Cassie L | $230,158 | |
| Previous Owner | Brenny Richard | $128,500 |
Source: Public Records
Tax History Compared to Growth
Tax History
| Year | Tax Paid | Tax Assessment Tax Assessment Total Assessment is a certain percentage of the fair market value that is determined by local assessors to be the total taxable value of land and additions on the property. | Land | Improvement |
|---|---|---|---|---|
| 2024 | $1,649 | $187,655 | $15,025 | $172,630 |
| 2023 | $1,525 | $168,439 | $15,025 | $153,414 |
| 2022 | $1,535 | $145,733 | $22,000 | $123,733 |
| 2021 | $1,529 | $119,035 | $19,250 | $99,785 |
| 2020 | $1,491 | $119,035 | $19,250 | $99,785 |
| 2019 | $1,510 | $119,035 | $19,250 | $99,785 |
| 2018 | $1,449 | $114,283 | $19,250 | $95,033 |
| 2017 | $14 | $113,485 | $19,250 | $94,235 |
| 2016 | $1,038 | $89,926 | $19,250 | $70,676 |
| 2015 | $373 | $35,000 | $35,000 | $0 |
| 2014 | $368 | $35,000 | $35,000 | $0 |
| 2013 | $376 | $35,000 | $35,000 | $0 |
Source: Public Records
Map
Nearby Homes
- 3543 W 700 N
- 486 N 3500 W
- 689 N 4250 W
- 631 N 4250 W
- 1168 N 4090 W
- 4190 W Delray Rd Unit 39
- 1198 N 4090 W
- 4181 W Delray Rd
- 2690 W 500 N
- 1428 N 4075 W
- 1482 N 4075 W
- 2993 W 1500 N
- 1388 N 4075 W
- 1298 N 4075 W
- 1320 N 4075 W
- 3019 W 250 S Unit 408
- 3017 W 250 S Unit 407
- 2396 W 1500 N
- 373 S 3240 W
- 521 N 2400 W
- 3559 W 700 N Unit 4
- 3559 W 700 N Unit 4
- 3543 W 700 N Unit 3
- 3573 W 700 N Unit 5
- 3573 W 700 N
- 3529 W 700 N
- 3564 W 700 N
- 3548 W 700 N Unit 23
- 3548 W 700 N
- 3580 W 700 N
- 3532 W 700 N
- 3515 W 700 N Unit 1
- 3515 W 700 N
- 3596 W 700 N
- 651 N 3500 W
- 715 N 3500 W
- 749 N 3500 W
- 625 N 3500 W
- 3619 W 700 N
- 3633 W 700 N