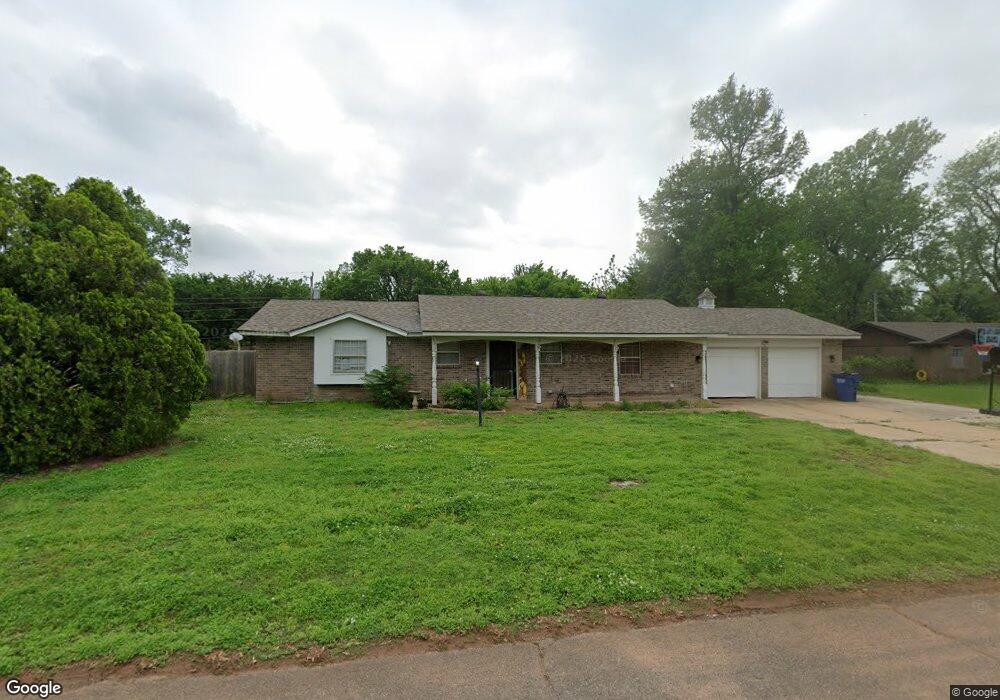
356 E Carson Ln Mustang, OK 73064
Estimated Value: $195,000 - $211,549
2
Beds
2
Baths
1,542
Sq Ft
$133/Sq Ft
Est. Value
About This Home
This home is located at 356 E Carson Ln, Mustang, OK 73064 and is currently estimated at $204,637, approximately $132 per square foot. 356 E Carson Ln is a home located in Canadian County with nearby schools including Mustang Elementary School, Mustang Horizon Intermediate School, and Mustang Middle School.
Ownership History
Date
Name
Owned For
Owner Type
Purchase Details
Closed on
Mar 21, 2014
Sold by
Figgins Brian G and Tate June A
Bought by
Fajen Sheryl L
Current Estimated Value
Home Financials for this Owner
Home Financials are based on the most recent Mortgage that was taken out on this home.
Original Mortgage
$107,025
Outstanding Balance
$81,666
Interest Rate
4.75%
Mortgage Type
FHA
Estimated Equity
$122,971
Purchase Details
Closed on
Jun 24, 2005
Sold by
Chamberlain Monica J and Clanco Monica J
Bought by
Figgins Brian G and Tate June A
Home Financials for this Owner
Home Financials are based on the most recent Mortgage that was taken out on this home.
Original Mortgage
$95,490
Interest Rate
5.78%
Mortgage Type
New Conventional
Purchase Details
Closed on
Aug 27, 2001
Sold by
Cleveland Myra G
Purchase Details
Closed on
Aug 28, 1999
Sold by
Cleveland Phillip R
Purchase Details
Closed on
Dec 8, 1995
Sold by
Priest Robert I
Purchase Details
Closed on
Mar 8, 1993
Sold by
Stanley Joyce Walker and Stanley Ronald
Create a Home Valuation Report for This Property
The Home Valuation Report is an in-depth analysis detailing your home's value as well as a comparison with similar homes in the area
Home Values in the Area
Average Home Value in this Area
Purchase History
| Date | Buyer | Sale Price | Title Company |
|---|---|---|---|
| Fajen Sheryl L | $109,000 | Ort | |
| Figgins Brian G | $79,875 | None Available | |
| -- | $84,000 | -- | |
| -- | -- | -- | |
| -- | $66,000 | -- | |
| -- | -- | -- |
Source: Public Records
Mortgage History
| Date | Status | Borrower | Loan Amount |
|---|---|---|---|
| Open | Fajen Sheryl L | $107,025 | |
| Previous Owner | Figgins Brian G | $95,490 |
Source: Public Records
Tax History
| Year | Tax Paid | Tax Assessment Tax Assessment Total Assessment is a certain percentage of the fair market value that is determined by local assessors to be the total taxable value of land and additions on the property. | Land | Improvement |
|---|---|---|---|---|
| 2025 | $1,557 | $16,774 | $3,000 | $13,774 |
| 2024 | $1,478 | $16,286 | $3,000 | $13,286 |
| 2023 | $1,478 | $15,811 | $3,000 | $12,811 |
| 2022 | $1,449 | $15,351 | $3,000 | $12,351 |
| 2021 | $1,472 | $15,522 | $3,000 | $12,522 |
| 2020 | $1,470 | $15,414 | $3,000 | $12,414 |
| 2019 | $1,425 | $14,965 | $3,000 | $11,965 |
| 2018 | $1,410 | $14,529 | $3,000 | $11,529 |
| 2017 | $1,369 | $14,284 | $3,000 | $11,284 |
| 2016 | $1,329 | $14,220 | $3,000 | $11,220 |
| 2015 | $1,192 | $13,464 | $3,000 | $10,464 |
| 2014 | $1,192 | $13,484 | $1,620 | $11,864 |
Source: Public Records
Map
Nearby Homes
- 806 S Meadow Ln
- 605 E Linden Ln
- 207 E Juniper Ln
- 316 E Greenwood Ln
- 312 E Greenwood Ln
- 516 S Brookview Ln
- 605 E Greenwood Ln
- 728 E Linden Ln
- 3917 Dutch Ln
- 3325 Little Creek Dr
- 3901 Dutch Ln
- 3909 Dutch Ln
- 3309 Little Creek Dr
- 1005 S Blackjack Ln
- 708 E Forest Court Ln
- 629 E Elder Ln
- 14842 SW 74th St
- 224 N Richard Terrace
- 12008 SW 36th St
- 933 S Bear Ln
- 348 E Carson Ln
- 408 E Carson Ln
- 416 E Carson Ln
- 1051 S Meadow Ln
- 407 E Carson Ln
- 340 E Carson Ln
- 415 E Carson Ln
- 339 E Carson Ln
- 1043 S Meadow Ln
- 424 E Carson Ln
- 1062 S Meadow Ln
- 423 E Carson Ln
- 332 E Carson Ln
- 331 E Carson Ln
- 1054 S Meadow Ln
- 432 E Carson Ln
- 431 E Carson Ln
- 324 E Carson Ln
- 1048 S Meadow Ln
- 323 E Carson Ln
Your Personal Tour Guide
Ask me questions while you tour the home.