Estimated Value: $304,993 - $352,000
5
Beds
4
Baths
2,318
Sq Ft
$140/Sq Ft
Est. Value
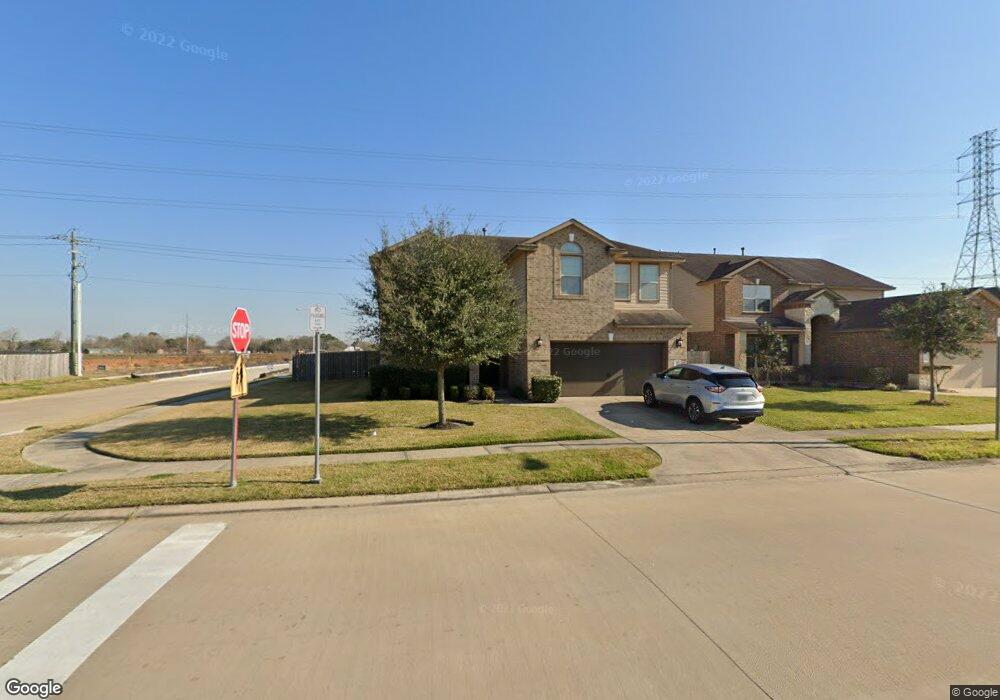
About This Home
This home is located at 356 Kendall Crest Dr, Alvin, TX 77511 and is currently estimated at $324,998, approximately $140 per square foot. 356 Kendall Crest Dr is a home located in Brazoria County with nearby schools including Mark Twain Elementary School, G.W. Harby Junior High School, and Alvin High School.
Ownership History
Date
Name
Owned For
Owner Type
Purchase Details
Closed on
Nov 24, 2024
Sold by
Ussery Brandon P
Bought by
Brandon Paul Ussery Private Irrevocable Trust and Brandon Paul Ussery Llc
Current Estimated Value
Home Financials for this Owner
Home Financials are based on the most recent Mortgage that was taken out on this home.
Original Mortgage
$247,769
Outstanding Balance
$245,225
Interest Rate
6.54%
Mortgage Type
New Conventional
Estimated Equity
$79,773
Purchase Details
Closed on
Dec 19, 2014
Sold by
D R Horton Texas Ltd
Bought by
Ussery Brandon P
Home Financials for this Owner
Home Financials are based on the most recent Mortgage that was taken out on this home.
Original Mortgage
$202,709
Interest Rate
3.62%
Mortgage Type
FHA
Purchase Details
Closed on
Nov 21, 2013
Sold by
Skymark Development Company Inc
Bought by
D R Horton Texas Ltd
Create a Home Valuation Report for This Property
The Home Valuation Report is an in-depth analysis detailing your home's value as well as a comparison with similar homes in the area
Home Values in the Area
Average Home Value in this Area
Purchase History
| Date | Buyer | Sale Price | Title Company |
|---|---|---|---|
| Brandon Paul Ussery Private Irrevocable Trust | -- | None Listed On Document | |
| Ussery Brandon P | -- | Dhi Title | |
| D R Horton Texas Ltd | -- | Dhi Title |
Source: Public Records
Mortgage History
| Date | Status | Borrower | Loan Amount |
|---|---|---|---|
| Open | Brandon Paul Ussery Private Irrevocable Trust | $247,769 | |
| Previous Owner | Ussery Brandon P | $202,709 |
Source: Public Records
Tax History Compared to Growth
Tax History
| Year | Tax Paid | Tax Assessment Tax Assessment Total Assessment is a certain percentage of the fair market value that is determined by local assessors to be the total taxable value of land and additions on the property. | Land | Improvement |
|---|---|---|---|---|
| 2025 | $7,561 | $310,940 | $58,580 | $252,360 |
| 2024 | $7,561 | $303,122 | $58,580 | $252,364 |
| 2023 | $7,561 | $275,565 | $58,580 | $252,240 |
| 2022 | $8,600 | $250,514 | $32,400 | $232,420 |
| 2021 | $8,169 | $227,740 | $32,400 | $195,340 |
| 2020 | $8,233 | $227,000 | $32,400 | $194,600 |
| 2019 | $7,815 | $211,000 | $21,230 | $189,770 |
| 2018 | $7,603 | $205,000 | $21,230 | $183,770 |
| 2017 | $7,596 | $202,710 | $21,230 | $181,480 |
| 2016 | $7,431 | $204,570 | $21,230 | $183,340 |
| 2015 | $847 | $180,280 | $21,230 | $159,050 |
| 2014 | $847 | $27,930 | $27,930 | $0 |
Source: Public Records
Map
Nearby Homes
- 350 Selah Ct
- 356 Selah Ct
- 340 Kendall Crest Dr
- 5307 Camerford Ct
- 334 Kendall Crest Dr
- 368 Selah Ct
- 5307 Cascade Ct
- Madison Plan at Kendall Lakes
- Avery Plan at Kendall Lakes
- Elias Plan at Skyview
- Christina Plan at Kendall Lakes
- Rev Plan at Skyview
- Trenton Plan at Kendall Lakes
- 5320 Latigo Ct
- Cleo Plan at Skyview
- Zara Plan at Skyview
- Myrtle Plan at Kendall Lakes
- 5318 Latigo Ct
- The Princeton II Plan at Kendall Lakes
- The Crawford Plan at Kendall Lakes
- 354 Kendall Crest Dr
- 352 Kendall Crest Dr
- 358 Kendall Crest Dr
- 350 Kendall Crest Dr
- 360 Kendall Crest Dr
- 348 Kendall Crest Dr
- 5199 Kendall Cove Ct
- 362 Kendall Crest Dr
- 361 Selah Ct
- 346 Kendall Crest Dr
- 364 Kendall Crest Dr
- 5195 Kendall Cove Ct
- 344 Kendall Crest Dr
- 366 Kendall Crest Dr
- 367 Selah Ct
- 5193 Kendall Cove Ct
- 5200 Kendall Cove Ct
- 342 Kendall Crest Dr
- 368 Kendall Crest Dr
- 5198 Kendall Cove Ct