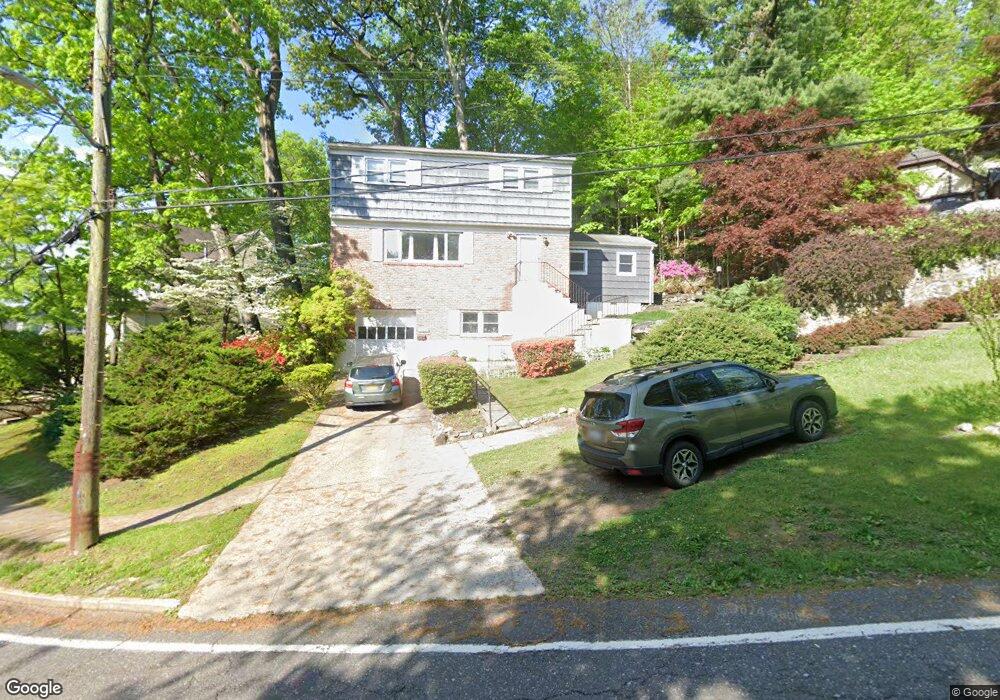
356 Mount Hope Blvd Hastings On Hudson, NY 10706
Estimated Value: $860,000 - $1,298,000
4
Beds
2
Baths
1,824
Sq Ft
$573/Sq Ft
Est. Value
About This Home
This home is located at 356 Mount Hope Blvd, Hastings On Hudson, NY 10706 and is currently estimated at $1,044,770, approximately $572 per square foot. 356 Mount Hope Blvd is a home located in Westchester County with nearby schools including Hastings High School, St Anthony Catholic School, and Hudson Lab School.
Ownership History
Date
Name
Owned For
Owner Type
Purchase Details
Closed on
Sep 14, 2010
Sold by
Rogers Richard J
Bought by
Rogers Richard J and Burns Jacqueline M
Current Estimated Value
Home Financials for this Owner
Home Financials are based on the most recent Mortgage that was taken out on this home.
Original Mortgage
$12,426
Outstanding Balance
$8,176
Interest Rate
4.37%
Mortgage Type
FHA
Estimated Equity
$1,036,594
Purchase Details
Closed on
Oct 2, 2008
Sold by
Rotanelli John V and Rotanelli Jeanette
Bought by
Rogers Richard J
Home Financials for this Owner
Home Financials are based on the most recent Mortgage that was taken out on this home.
Original Mortgage
$529,031
Outstanding Balance
$351,457
Interest Rate
6.41%
Mortgage Type
FHA
Estimated Equity
$693,313
Purchase Details
Closed on
Feb 15, 2001
Sold by
Arfer Donald and Arfer Irene
Bought by
Rotanelli John and Rotanelli Jeanette
Home Financials for this Owner
Home Financials are based on the most recent Mortgage that was taken out on this home.
Original Mortgage
$169,000
Interest Rate
6.85%
Mortgage Type
Purchase Money Mortgage
Create a Home Valuation Report for This Property
The Home Valuation Report is an in-depth analysis detailing your home's value as well as a comparison with similar homes in the area
Home Values in the Area
Average Home Value in this Area
Purchase History
| Date | Buyer | Sale Price | Title Company |
|---|---|---|---|
| Rogers Richard J | -- | Titleserv | |
| Rogers Richard J | $555,000 | None Available | |
| Rotanelli John | $380,000 | First American Title Ins Co |
Source: Public Records
Mortgage History
| Date | Status | Borrower | Loan Amount |
|---|---|---|---|
| Open | Rogers Richard J | $12,426 | |
| Open | Rogers Richard J | $529,031 | |
| Previous Owner | Rotanelli John | $169,000 |
Source: Public Records
Tax History Compared to Growth
Tax History
| Year | Tax Paid | Tax Assessment Tax Assessment Total Assessment is a certain percentage of the fair market value that is determined by local assessors to be the total taxable value of land and additions on the property. | Land | Improvement |
|---|---|---|---|---|
| 2024 | $24,790 | $913,400 | $401,600 | $511,800 |
| 2023 | $23,441 | $855,000 | $382,500 | $472,500 |
| 2022 | $22,279 | $783,800 | $382,500 | $401,300 |
| 2021 | $22,652 | $712,500 | $382,500 | $330,000 |
| 2020 | $22,461 | $708,200 | $402,600 | $305,600 |
| 2019 | $21,760 | $708,200 | $402,600 | $305,600 |
| 2018 | $23,201 | $689,100 | $402,600 | $286,500 |
| 2017 | $3,978 | $663,600 | $402,600 | $261,000 |
| 2016 | $512,091 | $638,000 | $402,600 | $235,400 |
| 2015 | -- | $14,800 | $2,200 | $12,600 |
| 2014 | -- | $14,800 | $2,200 | $12,600 |
| 2013 | -- | $14,800 | $2,200 | $12,600 |
Source: Public Records
Map
Nearby Homes
- 83 Ravensdale Rd
- 244 Mount Hope Blvd
- 22 Lincoln Ave
- 40 Dorchester Ave
- 12 Glenn Place
- 42 Ravensdale Rd
- 25 Fenwick Rd
- 51 Branford Rd
- 24 School St
- 100 Clarewood Dr Unit 4G
- 65 Circle Dr
- 31 Hillside Ave
- 29 Brandt St
- 10 Old Jackson Ave Unit 72
- 445 Broadway Unit 2R
- 445 Broadway Unit 2-O
- 445 Broadway Unit 3A
- 40 Floral Dr
- 555 Broadway Unit 1H
- 565 Broadway Unit 1A
- 71 Stanley Ave
- 67 Stanley Ave
- 24 Garland Dr
- 63 Stanley Ave
- 360 Mount Hope Blvd
- 357 Mt Hope Blvd Unit 2nd floor
- 357 Mount Hope Blvd Unit 2nd floor
- 357 Mount Hope Blvd
- 53 Stanley Ave
- 15 Garland Dr
- 37 Garland Dr
- 347 Mount Hope Blvd
- 9 Garland Dr
- 19 Overlook Rd
- 21 Overlook Rd
- 341 Mount Hope Blvd
- 342 Mount Hope Blvd
- 45 Stanley Ave
- 133 Fairmont Ave
- 23 Overlook Rd