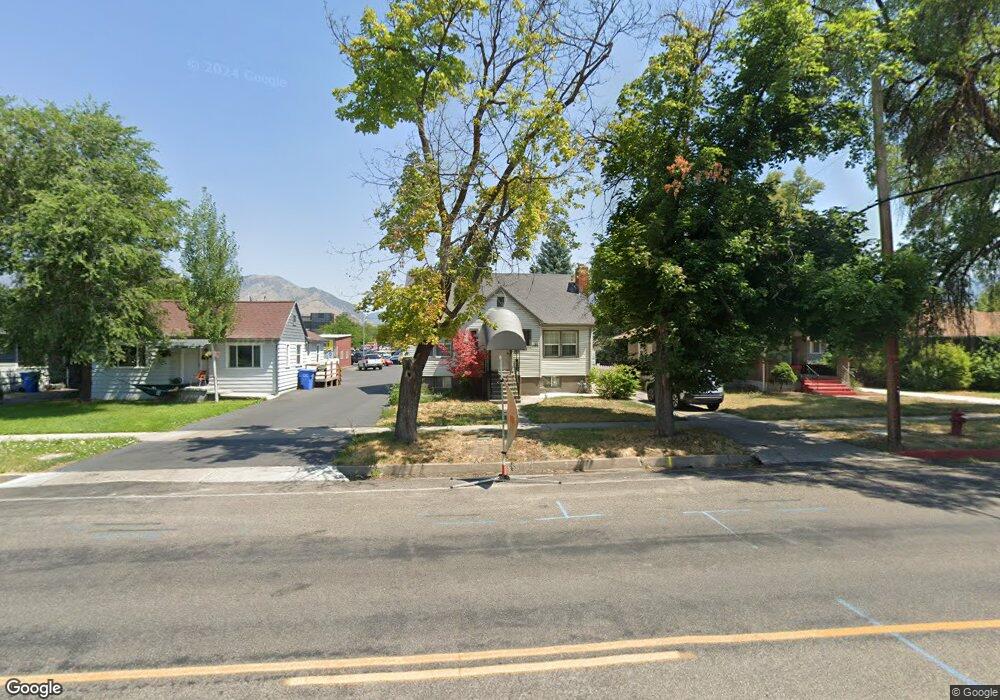
356 N 100 W Logan, UT 84321
Ellis NeighborhoodEstimated Value: $339,000 - $503,000
5
Beds
3
Baths
2,593
Sq Ft
$159/Sq Ft
Est. Value
About This Home
This home is located at 356 N 100 W, Logan, UT 84321 and is currently estimated at $413,472, approximately $159 per square foot. 356 N 100 W is a home located in Cache County with nearby schools including Ellis School, Mount Logan Middle School, and Logan High School.
Ownership History
Date
Name
Owned For
Owner Type
Purchase Details
Closed on
May 5, 2018
Sold by
Larsen Norman and Larsen Norman L
Bought by
Nll Holdings Llc
Current Estimated Value
Purchase Details
Closed on
Aug 31, 2017
Sold by
Tufts Jordan T and Tufts Melissa A
Bought by
Larsen Norman L and Larsen Charlotte
Home Financials for this Owner
Home Financials are based on the most recent Mortgage that was taken out on this home.
Original Mortgage
$81,000
Interest Rate
3.93%
Mortgage Type
New Conventional
Purchase Details
Closed on
Jan 27, 2012
Sold by
Hopkins Western Fund Llc
Bought by
Tufts Jordan D and Tufts Melissa A
Home Financials for this Owner
Home Financials are based on the most recent Mortgage that was taken out on this home.
Original Mortgage
$126,704
Interest Rate
3.75%
Mortgage Type
FHA
Create a Home Valuation Report for This Property
The Home Valuation Report is an in-depth analysis detailing your home's value as well as a comparison with similar homes in the area
Home Values in the Area
Average Home Value in this Area
Purchase History
| Date | Buyer | Sale Price | Title Company |
|---|---|---|---|
| Nll Holdings Llc | -- | Northern Title | |
| Larsen Norman L | -- | Advanced Title | |
| Tufts Jordan D | -- | Pinnacle Title Ins Agency |
Source: Public Records
Mortgage History
| Date | Status | Borrower | Loan Amount |
|---|---|---|---|
| Previous Owner | Larsen Norman L | $81,000 | |
| Previous Owner | Tufts Jordan D | $126,704 |
Source: Public Records
Tax History Compared to Growth
Tax History
| Year | Tax Paid | Tax Assessment Tax Assessment Total Assessment is a certain percentage of the fair market value that is determined by local assessors to be the total taxable value of land and additions on the property. | Land | Improvement |
|---|---|---|---|---|
| 2025 | $1,766 | $228,410 | $0 | $0 |
| 2024 | $1,814 | $227,190 | $0 | $0 |
| 2023 | $1,908 | $227,780 | $0 | $0 |
| 2022 | $2,046 | $228,165 | $0 | $0 |
| 2021 | $1,684 | $290,040 | $42,000 | $248,040 |
| 2020 | $1,502 | $232,800 | $42,000 | $190,800 |
| 2019 | $1,570 | $232,800 | $42,000 | $190,800 |
| 2018 | $1,243 | $168,336 | $42,000 | $126,336 |
| 2017 | $1,189 | $85,140 | $0 | $0 |
| 2016 | $1,233 | $79,640 | $0 | $0 |
| 2015 | $1,154 | $79,640 | $0 | $0 |
| 2014 | $1,044 | $79,640 | $0 | $0 |
| 2013 | -- | $70,565 | $0 | $0 |
Source: Public Records
Map
Nearby Homes