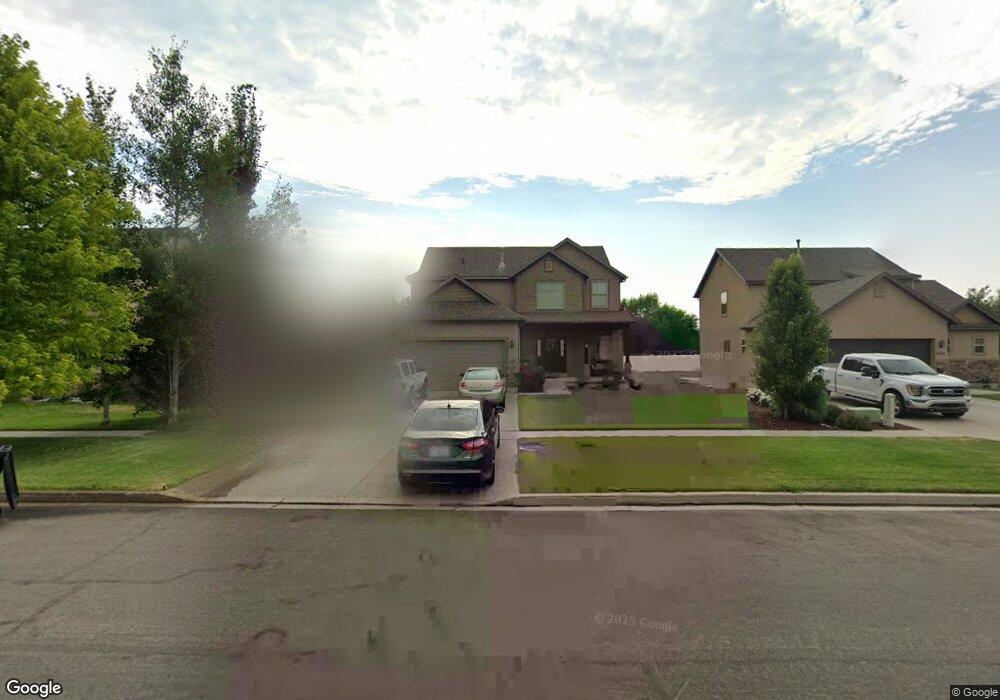
356 N 500 W Heber City, UT 84032
Estimated Value: $582,000 - $675,812
3
Beds
3
Baths
2,471
Sq Ft
$256/Sq Ft
Est. Value
About This Home
This home is located at 356 N 500 W, Heber City, UT 84032 and is currently estimated at $631,953, approximately $255 per square foot. 356 N 500 W is a home located in Wasatch County with nearby schools including Heber Valley Elementary School, Rocky Mountain Middle School, and Wasatch High School.
Ownership History
Date
Name
Owned For
Owner Type
Purchase Details
Closed on
Sep 27, 2010
Sold by
Ocwen Loan Servicing Llc
Bought by
Federal Home Loan Mortgage Corp
Current Estimated Value
Purchase Details
Closed on
Dec 16, 2007
Sold by
Pine Valley Builders Inc
Bought by
Withers Spencer James
Home Financials for this Owner
Home Financials are based on the most recent Mortgage that was taken out on this home.
Original Mortgage
$37,900
Interest Rate
6.09%
Mortgage Type
Purchase Money Mortgage
Purchase Details
Closed on
Nov 21, 2006
Sold by
Climb Investments Llc
Bought by
Withers Spencer James
Home Financials for this Owner
Home Financials are based on the most recent Mortgage that was taken out on this home.
Original Mortgage
$306,000
Interest Rate
6.36%
Mortgage Type
Purchase Money Mortgage
Create a Home Valuation Report for This Property
The Home Valuation Report is an in-depth analysis detailing your home's value as well as a comparison with similar homes in the area
Home Values in the Area
Average Home Value in this Area
Purchase History
| Date | Buyer | Sale Price | Title Company |
|---|---|---|---|
| Federal Home Loan Mortgage Corp | -- | Accommodation | |
| Withers Spencer James | -- | Title West Slc | |
| Withers Spencer James | -- | Union Title |
Source: Public Records
Mortgage History
| Date | Status | Borrower | Loan Amount |
|---|---|---|---|
| Previous Owner | Withers Spencer James | $37,900 | |
| Previous Owner | Withers Spencer James | $306,000 |
Source: Public Records
Tax History Compared to Growth
Tax History
| Year | Tax Paid | Tax Assessment Tax Assessment Total Assessment is a certain percentage of the fair market value that is determined by local assessors to be the total taxable value of land and additions on the property. | Land | Improvement |
|---|---|---|---|---|
| 2025 | $3,145 | $635,526 | $240,000 | $395,526 |
| 2024 | $3,145 | $618,135 | $240,000 | $378,135 |
| 2023 | $3,145 | $534,380 | $125,000 | $409,380 |
| 2022 | $2,317 | $416,480 | $125,000 | $291,480 |
| 2021 | $2,111 | $301,365 | $114,000 | $187,365 |
| 2020 | $1,923 | $267,365 | $80,000 | $187,365 |
| 2019 | $1,822 | $147,051 | $0 | $0 |
| 2018 | $1,686 | $136,051 | $0 | $0 |
| 2017 | $1,695 | $136,051 | $0 | $0 |
| 2016 | $1,741 | $136,051 | $0 | $0 |
| 2015 | $2,689 | $220,365 | $0 | $0 |
| 2014 | -- | $236,251 | $70,000 | $166,251 |
Source: Public Records
Map
Nearby Homes