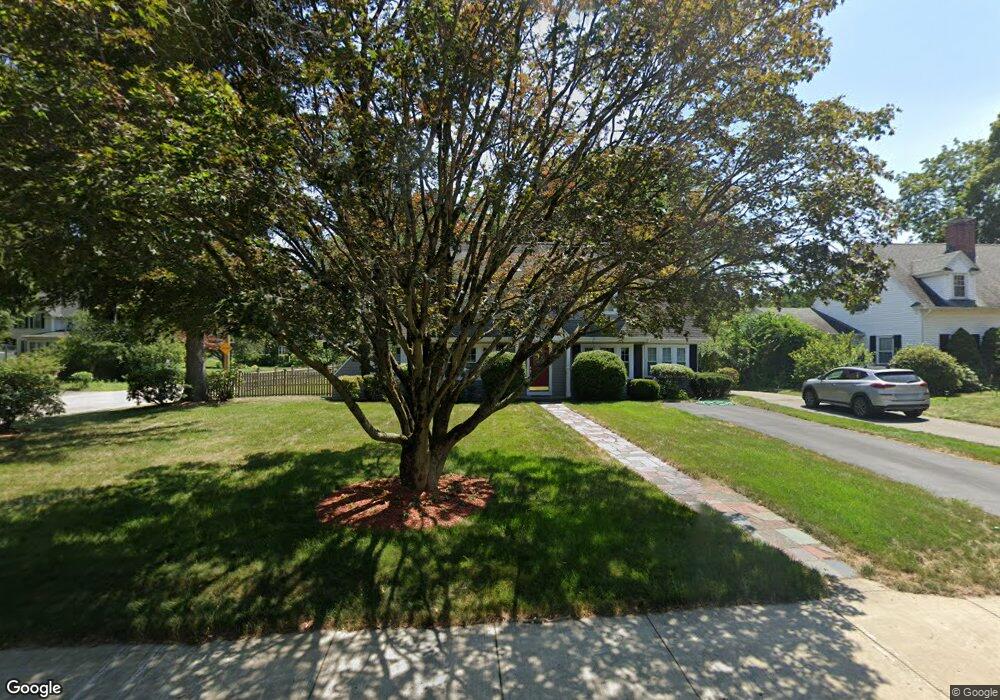
356 S Main St Attleboro, MA 02703
Estimated Value: $552,906 - $606,000
3
Beds
2
Baths
1,956
Sq Ft
$292/Sq Ft
Est. Value
About This Home
This home is located at 356 S Main St, Attleboro, MA 02703 and is currently estimated at $571,977, approximately $292 per square foot. 356 S Main St is a home located in Bristol County with nearby schools including Peter Thacher Elementary School, Wamsutta Middle School, and Attleboro High School.
Ownership History
Date
Name
Owned For
Owner Type
Purchase Details
Closed on
May 15, 2013
Sold by
Holcomb Laura M and Holcomb Scott C
Bought by
Holcomb Laura M
Current Estimated Value
Home Financials for this Owner
Home Financials are based on the most recent Mortgage that was taken out on this home.
Original Mortgage
$177,000
Outstanding Balance
$125,929
Interest Rate
3.57%
Mortgage Type
Stand Alone Refi Refinance Of Original Loan
Estimated Equity
$446,048
Purchase Details
Closed on
Jul 30, 1999
Sold by
Titus Francis W and Titus Mary D
Bought by
Holcomb Scott C and Holcomb Laura M
Purchase Details
Closed on
Sep 28, 1998
Sold by
Vallely Vincent Y and Countrywide Home Loan
Bought by
Titus Frnces W and Titus Mary D
Purchase Details
Closed on
Oct 13, 1992
Sold by
Smith James M and Smith Mary M
Bought by
Vallely Vincent Y and Valley Pamela J
Create a Home Valuation Report for This Property
The Home Valuation Report is an in-depth analysis detailing your home's value as well as a comparison with similar homes in the area
Home Values in the Area
Average Home Value in this Area
Purchase History
| Date | Buyer | Sale Price | Title Company |
|---|---|---|---|
| Holcomb Laura M | -- | -- | |
| Holcomb Scott C | $135,000 | -- | |
| Titus Frnces W | $125,200 | -- | |
| Vallely Vincent Y | $121,400 | -- |
Source: Public Records
Mortgage History
| Date | Status | Borrower | Loan Amount |
|---|---|---|---|
| Open | Holcomb Laura M | $177,000 | |
| Closed | Holcomb Laura M | $77,500 | |
| Previous Owner | Vallely Vincent Y | $179,000 | |
| Previous Owner | Vallely Vincent Y | $35,000 |
Source: Public Records
Tax History Compared to Growth
Tax History
| Year | Tax Paid | Tax Assessment Tax Assessment Total Assessment is a certain percentage of the fair market value that is determined by local assessors to be the total taxable value of land and additions on the property. | Land | Improvement |
|---|---|---|---|---|
| 2025 | $5,483 | $436,900 | $130,100 | $306,800 |
| 2024 | $5,362 | $421,200 | $130,100 | $291,100 |
| 2023 | $4,904 | $358,200 | $118,400 | $239,800 |
| 2022 | $4,712 | $326,100 | $112,800 | $213,300 |
| 2021 | $4 | $317,800 | $108,500 | $209,300 |
| 2020 | $4,518 | $310,300 | $105,300 | $205,000 |
| 2019 | $4,409 | $311,400 | $103,400 | $208,000 |
| 2018 | $0 | $288,800 | $100,400 | $188,400 |
| 2017 | $4 | $289,600 | $100,400 | $189,200 |
| 2016 | $4,086 | $275,700 | $93,600 | $182,100 |
| 2015 | $3,978 | $270,400 | $93,600 | $176,800 |
| 2014 | $3,917 | $263,800 | $88,700 | $175,100 |
Source: Public Records
Map
Nearby Homes
- 75 Grant St
- 429 S Main St Unit 1
- 3 Grant St
- 115 Ellis St
- 3 Dailey St Unit J
- 26 Lamb St
- 248 S Main St
- 0 Tulip Unit 73410552
- 0 Tulip Unit 73407296
- 172 Downing Dr
- 309 Thacher St
- 63 Orange St
- 52 Orange St
- 44 Mulberry St
- 62 Garden St Unit 3
- 24 Oakland Ave Unit 1
- 22 Oakland Ave Unit 1
- 804 County St
- 41 Garden St Unit A
- 9 Parker Ct