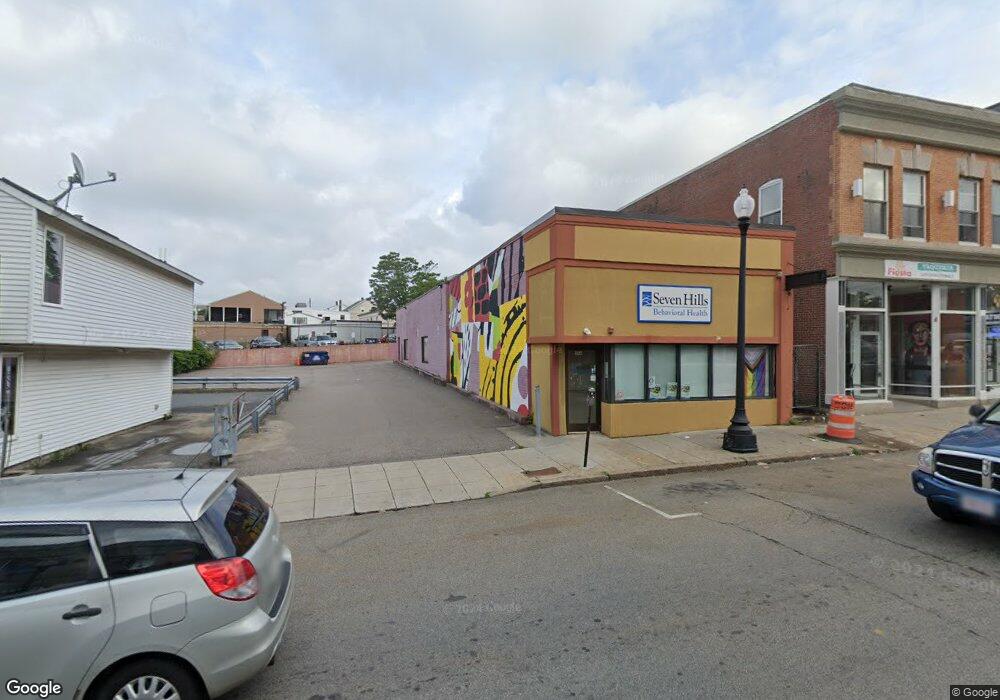
356 S Main St Fall River, MA 02721
Corky Row NeighborhoodEstimated Value: $729,453
Studio
--
Bath
2,530
Sq Ft
$288/Sq Ft
Est. Value
About This Home
This home is located at 356 S Main St, Fall River, MA 02721 and is currently estimated at $729,453, approximately $288 per square foot. 356 S Main St is a home located in Bristol County with nearby schools including Henry Lord Community School, B M C Durfee High School, and Argosy Collegiate Charter School.
Ownership History
Date
Name
Owned For
Owner Type
Purchase Details
Closed on
Aug 10, 2018
Sold by
Laurel Street Rt
Bought by
Zhang Ming J
Current Estimated Value
Purchase Details
Closed on
Apr 9, 2007
Sold by
Dematos Alvaro J and Dematos Roslind J
Bought by
Laurel Street Rt
Purchase Details
Closed on
Dec 22, 2005
Sold by
Dematos Alvaro J and Dematos Roslind J
Bought by
Laurel Rt
Purchase Details
Closed on
Mar 12, 2003
Sold by
Sheroff Melvin S and Sheroff Robert M
Bought by
Dematos Alvaro J and Dematos Roslind J
Create a Home Valuation Report for This Property
The Home Valuation Report is an in-depth analysis detailing your home's value as well as a comparison with similar homes in the area
Home Values in the Area
Average Home Value in this Area
Purchase History
| Date | Buyer | Sale Price | Title Company |
|---|---|---|---|
| Zhang Ming J | -- | -- | |
| Laurel Street Rt | -- | -- | |
| Laurel Rt | $405,000 | -- | |
| Dematos Alvaro J | $250,000 | -- |
Source: Public Records
Tax History
| Year | Tax Paid | Tax Assessment Tax Assessment Total Assessment is a certain percentage of the fair market value that is determined by local assessors to be the total taxable value of land and additions on the property. | Land | Improvement |
|---|---|---|---|---|
| 2025 | $9,754 | $409,300 | $161,400 | $247,900 |
| 2024 | $9,463 | $395,300 | $153,800 | $241,500 |
| 2023 | $8,890 | $345,100 | $128,200 | $216,900 |
| 2022 | $9,328 | $345,100 | $128,200 | $216,900 |
| 2021 | $9,020 | $303,700 | $128,200 | $175,500 |
| 2020 | $8,929 | $291,700 | $118,500 | $173,200 |
| 2019 | $9,010 | $287,300 | $118,500 | $168,800 |
| 2018 | $9,162 | $294,400 | $118,500 | $175,900 |
| 2017 | $9,020 | $294,400 | $118,500 | $175,900 |
| 2016 | $8,622 | $296,000 | $118,500 | $177,500 |
| 2015 | $8,329 | $296,000 | $118,500 | $177,500 |
| 2014 | $7,897 | $296,000 | $118,500 | $177,500 |
Source: Public Records
Map
Nearby Homes
- 348 S Main St
- 362 S Main St
- 340 S Main St
- 394 S Main St
- 376 S Main St
- 335 S Main St
- 31 Rodman St
- 31 Rodman St
- 31 Rodman St
- 29 Rodman
- 333 S Main St
- 308 S Main St
- 390 S Main St Unit 202
- 390 S Main St Unit suite2
- 390 S Main St Unit storefront
- 390 S Main St Unit 201
- 390 S Main St
- 371 S Main St
- 53 Rodman St
- 400 S Main St Unit E
Your Personal Tour Guide
Ask me questions while you tour the home.