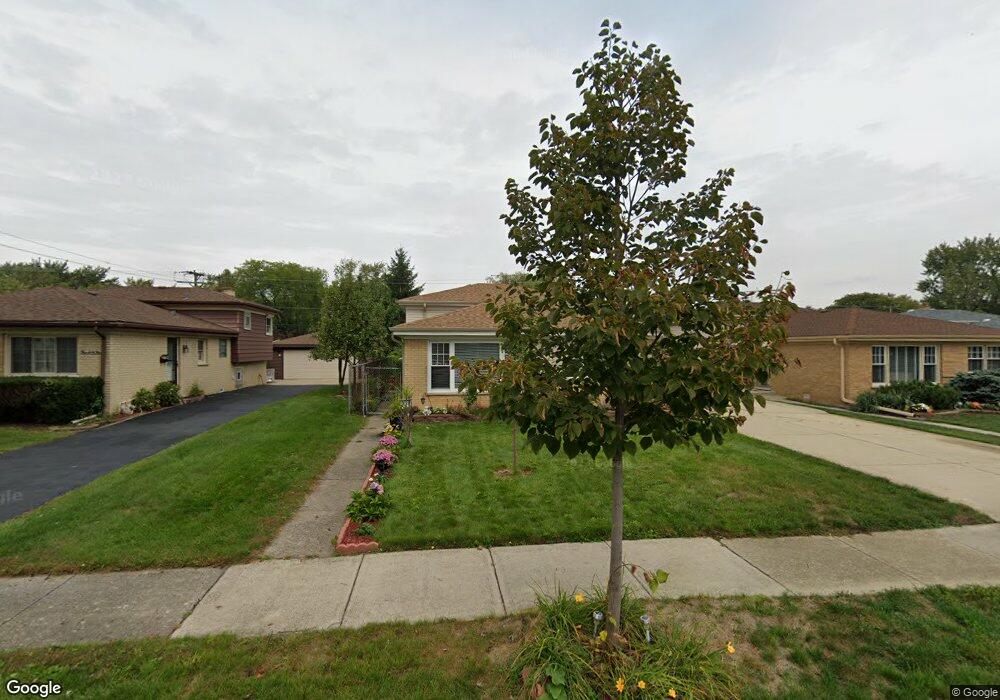
356 W Myrick Ave Addison, IL 60101
Estimated Value: $338,912 - $379,000
--
Bed
1
Bath
1,913
Sq Ft
$192/Sq Ft
Est. Value
About This Home
This home is located at 356 W Myrick Ave, Addison, IL 60101 and is currently estimated at $366,478, approximately $191 per square foot. 356 W Myrick Ave is a home located in DuPage County with nearby schools including Lake Park Elementary School, Indian Trail Jr High School, and Addison Trail High School.
Ownership History
Date
Name
Owned For
Owner Type
Purchase Details
Closed on
Jun 1, 2015
Sold by
Oxford Bank & Trust
Bought by
Aburto Galdino and Aburto Maria E
Current Estimated Value
Purchase Details
Closed on
May 27, 2005
Sold by
Aburto Galdino and Aburto Eustacia
Bought by
Oxford Bank & Trust and Trust #640
Home Financials for this Owner
Home Financials are based on the most recent Mortgage that was taken out on this home.
Original Mortgage
$805,000
Interest Rate
6.5%
Mortgage Type
Purchase Money Mortgage
Purchase Details
Closed on
Oct 28, 2000
Sold by
Aburto Jose Luis and Aburto Galdino
Bought by
Aburto Galdino and Aburto Eustacia
Purchase Details
Closed on
Dec 30, 1996
Sold by
Finucane Daniel P and Finucane Sherry Kay
Bought by
Aburto Galdino and Aburto Maria Eustacia
Home Financials for this Owner
Home Financials are based on the most recent Mortgage that was taken out on this home.
Original Mortgage
$134,509
Interest Rate
7.6%
Mortgage Type
FHA
Create a Home Valuation Report for This Property
The Home Valuation Report is an in-depth analysis detailing your home's value as well as a comparison with similar homes in the area
Home Values in the Area
Average Home Value in this Area
Purchase History
| Date | Buyer | Sale Price | Title Company |
|---|---|---|---|
| Aburto Galdino | -- | Ctic Dupage | |
| Oxford Bank & Trust | -- | Plm Title Company | |
| Aburto Galdino | -- | First American Title Ins | |
| Aburto Galdino | $138,500 | -- |
Source: Public Records
Mortgage History
| Date | Status | Borrower | Loan Amount |
|---|---|---|---|
| Previous Owner | Oxford Bank & Trust | $805,000 | |
| Previous Owner | Aburto Galdino | $134,509 |
Source: Public Records
Tax History Compared to Growth
Tax History
| Year | Tax Paid | Tax Assessment Tax Assessment Total Assessment is a certain percentage of the fair market value that is determined by local assessors to be the total taxable value of land and additions on the property. | Land | Improvement |
|---|---|---|---|---|
| 2024 | $4,554 | $113,631 | $42,424 | $71,207 |
| 2023 | $4,757 | $104,460 | $39,000 | $65,460 |
| 2022 | $6,410 | $98,040 | $36,610 | $61,430 |
| 2021 | $5,142 | $93,910 | $35,070 | $58,840 |
| 2020 | $5,236 | $89,950 | $33,590 | $56,360 |
| 2019 | $5,421 | $86,490 | $32,300 | $54,190 |
| 2018 | $6,058 | $80,620 | $30,750 | $49,870 |
| 2017 | $5,897 | $77,050 | $29,390 | $47,660 |
| 2016 | $5,732 | $71,130 | $27,130 | $44,000 |
| 2015 | $5,582 | $65,710 | $25,060 | $40,650 |
| 2014 | $5,658 | $66,140 | $22,970 | $43,170 |
| 2013 | $5,545 | $67,490 | $23,440 | $44,050 |
Source: Public Records
Map
Nearby Homes
- 36 S Highview Ave
- 427 W Moreland Ave
- 10 N Adams Dr
- 110 S Evergreen Ave
- 539 W Rose Ave
- 84 N Mill Rd
- 621 W Natalie Ln
- 152 N May St
- 200 Addison Rd
- 235 N Mill Rd Unit 115B
- 231 N Mill Rd Unit 11
- 426 S Adeline Ave
- 112 S Iowa Ave
- 257 Masters Dr
- 276 Masters Dr
- 329 Masters Dr
- 330 Masters Dr
- 385 Masters Dr
- 379 Masters Dr
- 768 W St Johns Place
- 364 W Myrick Ave
- 348 W Myrick Ave
- 340 W Myrick Ave
- 35 S Highview Ave
- 365 W Myrick Ave
- 357 W Diversey Ave
- 365 W Diversey Ave
- 349 W Diversey Ave
- 334 W Myrick Ave
- 1 S Highview Ave
- 78 S Grant Dr
- 375 W Myrick Ave
- 341 W Diversey Ave
- 65 S Grant Dr
- 10 S Highview Ave
- 333 W Diversey Ave
- 319 W Myrick Ave
- 77 S Highview Ave
- 90 S Grant Dr
- 89 S Grant Dr