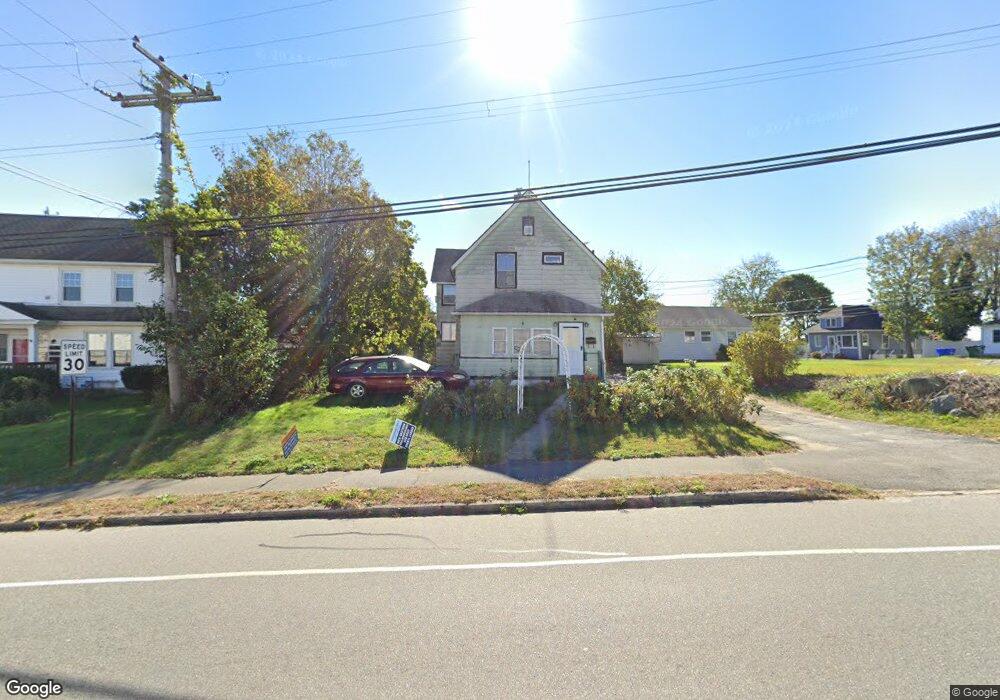
356 Willetts Ave Waterford, CT 06385
Estimated Value: $282,000 - $303,144
3
Beds
1
Bath
994
Sq Ft
$293/Sq Ft
Est. Value
About This Home
This home is located at 356 Willetts Ave, Waterford, CT 06385 and is currently estimated at $290,786, approximately $292 per square foot. 356 Willetts Ave is a home located in New London County with nearby schools including Clark Lane Middle School, Waterford High School, and St. Joseph School.
Ownership History
Date
Name
Owned For
Owner Type
Purchase Details
Closed on
Dec 13, 2022
Sold by
Grabel Jeremy E
Bought by
Grabel Jeremy E and Grabel Megan D
Current Estimated Value
Home Financials for this Owner
Home Financials are based on the most recent Mortgage that was taken out on this home.
Original Mortgage
$183,150
Outstanding Balance
$177,303
Interest Rate
6.61%
Mortgage Type
FHA
Estimated Equity
$113,483
Create a Home Valuation Report for This Property
The Home Valuation Report is an in-depth analysis detailing your home's value as well as a comparison with similar homes in the area
Home Values in the Area
Average Home Value in this Area
Purchase History
| Date | Buyer | Sale Price | Title Company |
|---|---|---|---|
| Grabel Jeremy E | -- | None Available | |
| Grabel Jeremy E | -- | None Available |
Source: Public Records
Mortgage History
| Date | Status | Borrower | Loan Amount |
|---|---|---|---|
| Open | Grabel Jeremy E | $183,150 | |
| Closed | Grabel Jeremy E | $183,150 |
Source: Public Records
Tax History Compared to Growth
Tax History
| Year | Tax Paid | Tax Assessment Tax Assessment Total Assessment is a certain percentage of the fair market value that is determined by local assessors to be the total taxable value of land and additions on the property. | Land | Improvement |
|---|---|---|---|---|
| 2025 | $2,774 | $118,760 | $52,890 | $65,870 |
| 2024 | $2,648 | $118,760 | $52,890 | $65,870 |
| 2023 | $2,248 | $106,030 | $52,890 | $53,140 |
| 2022 | $2,419 | $87,760 | $50,080 | $37,680 |
| 2021 | $2,426 | $87,760 | $50,080 | $37,680 |
| 2020 | $2,446 | $87,760 | $50,080 | $37,680 |
| 2019 | $2,456 | $87,760 | $50,080 | $37,680 |
| 2018 | $2,406 | $87,760 | $50,080 | $37,680 |
| 2017 | $2,131 | $78,820 | $35,770 | $43,050 |
| 2016 | $2,111 | $78,820 | $35,770 | $43,050 |
| 2015 | $2,036 | $78,820 | $35,770 | $43,050 |
| 2014 | $2,036 | $78,820 | $35,770 | $43,050 |
Source: Public Records
Map
Nearby Homes