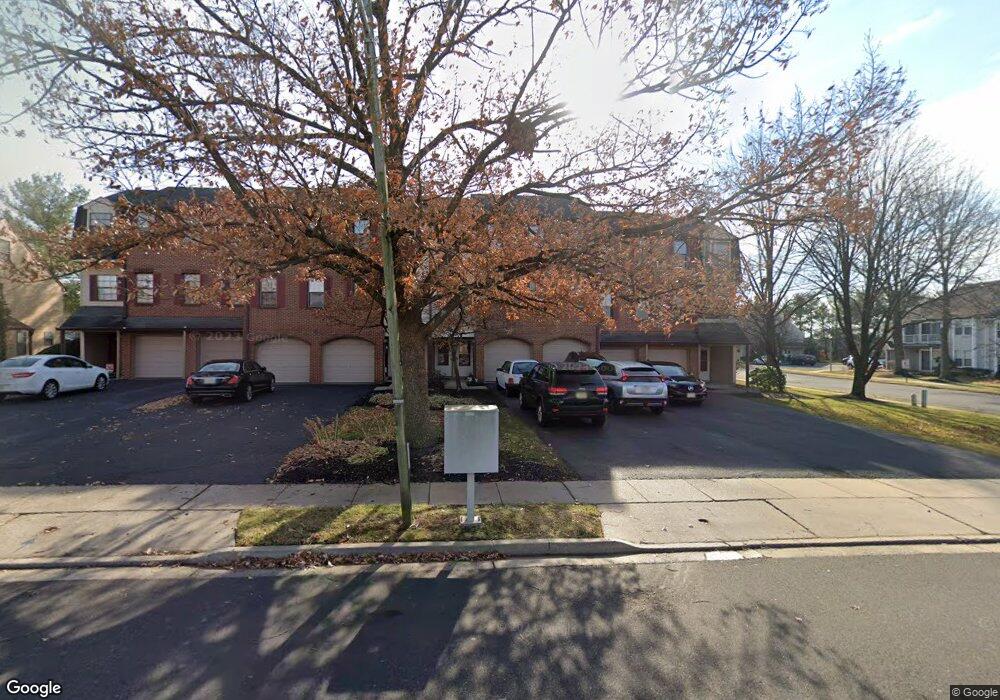
356 Willow Turn Mount Laurel, NJ 08054
Estimated Value: $275,000 - $290,000
2
Beds
2
Baths
1,208
Sq Ft
$234/Sq Ft
Est. Value
About This Home
This home is located at 356 Willow Turn, Mount Laurel, NJ 08054 and is currently estimated at $282,256, approximately $233 per square foot. 356 Willow Turn is a home located in Burlington County with nearby schools including Larchmont Elementary School, Mount Laurel Hartford School, and T.E. Harrington Middle School.
Ownership History
Date
Name
Owned For
Owner Type
Purchase Details
Closed on
Jul 14, 2005
Sold by
Riley Kelly D and Riley Joyce L
Bought by
Riley Kelly D and Riley Joyce L
Current Estimated Value
Home Financials for this Owner
Home Financials are based on the most recent Mortgage that was taken out on this home.
Original Mortgage
$152,000
Outstanding Balance
$90,681
Interest Rate
7.95%
Mortgage Type
Fannie Mae Freddie Mac
Estimated Equity
$191,575
Purchase Details
Closed on
Jul 29, 2004
Sold by
Heulitt Wayne F and Heulitt Ellen F
Bought by
Riley Kelly D and Riley Joyce L
Home Financials for this Owner
Home Financials are based on the most recent Mortgage that was taken out on this home.
Original Mortgage
$128,250
Interest Rate
6.16%
Mortgage Type
FHA
Purchase Details
Closed on
Sep 28, 1996
Sold by
Anastasi Elaine W
Bought by
Heulitt Wayne F and Heulitt Ellen F
Create a Home Valuation Report for This Property
The Home Valuation Report is an in-depth analysis detailing your home's value as well as a comparison with similar homes in the area
Home Values in the Area
Average Home Value in this Area
Purchase History
| Date | Buyer | Sale Price | Title Company |
|---|---|---|---|
| Riley Kelly D | -- | Surety Title Corp | |
| Riley Kelly D | $135,000 | Integrity Title Agency Inc | |
| Heulitt Wayne F | $72,000 | Lawrence Abstract Company |
Source: Public Records
Mortgage History
| Date | Status | Borrower | Loan Amount |
|---|---|---|---|
| Open | Riley Kelly D | $152,000 | |
| Closed | Riley Kelly D | $128,250 |
Source: Public Records
Tax History
| Year | Tax Paid | Tax Assessment Tax Assessment Total Assessment is a certain percentage of the fair market value that is determined by local assessors to be the total taxable value of land and additions on the property. | Land | Improvement |
|---|---|---|---|---|
| 2025 | $3,987 | $126,300 | $25,000 | $101,300 |
| 2024 | $3,837 | $126,300 | $25,000 | $101,300 |
| 2023 | $3,837 | $126,300 | $25,000 | $101,300 |
| 2022 | $3,824 | $126,300 | $25,000 | $101,300 |
| 2021 | $3,752 | $126,300 | $25,000 | $101,300 |
| 2020 | $3,679 | $126,300 | $25,000 | $101,300 |
| 2019 | $3,641 | $126,300 | $25,000 | $101,300 |
| 2018 | $3,613 | $126,300 | $25,000 | $101,300 |
| 2017 | $3,520 | $126,300 | $25,000 | $101,300 |
| 2016 | $3,467 | $126,300 | $25,000 | $101,300 |
| 2015 | $3,427 | $126,300 | $25,000 | $101,300 |
| 2014 | $3,392 | $126,300 | $25,000 | $101,300 |
Source: Public Records
Map
Nearby Homes
- 438B Willow Turn
- 114 Burnamwood Ct
- 2402B Sedgefield Dr Unit 2402B
- 125 Sharrow Ln
- 2904 B Heatherstone Ct
- 143 Banwell Ln
- 2705A Heatherstone Ct Unit 2705
- 102B Sedgefield Dr Unit 102B
- 882A Scotswood Ct Unit 882
- 308B Sedgefield Dr
- 115 Banwell Ln
- 3522B Neils Ct Unit 3522B
- 3190B Neils Ct
- 606B Saxony Dr Unit 606
- 5214C Aberdeen Dr Unit C
- 220 Hartford Rd
- 901A Saxony Dr
- 4102B Adelaide Dr Unit 4102B
- 210 Martins Way Unit 210
- 216 Martins Way Unit 216
- 356B Willow Turn Unit 356B
- 356A Willow Turn Unit 356A
- 358 Willow Turn
- 358A Willow Turn Unit 358A
- 354B Willow Turn Unit 354B
- 354 Willow Turn
- 354A Willow Turn
- 352B Willow Turn Unit 352B
- 352A Willow Turn Unit 352A
- 352 Willow Turn
- 314A Mitten Ln Unit A
- 314 Mitten Ln Unit A
- 314A Mitten Ln Unit 314A
- 314 Mitten Ln
- 314B Mitten Ln
- 312 Mitten Ln
- 312A Mitten Ln Unit 31201
- 312A Mitten Ln Unit A
- 312B Mitten Ln Unit 31202
- 350 Willow Turn Unit 350
Your Personal Tour Guide
Ask me questions while you tour the home.